What's new
  • Happy Birthday ICMag! Been 20 years since Gypsy Nirvana created the forum! We are celebrating with a 4/20 Giveaway and by launching a new Patreon tier called "420club". You can read more here.
  • Important notice: ICMag's T.O.U. has been updated. Please review it here. For your convenience, it is also available in the main forum menu, under 'Quick Links"!

Cannabis absorptance spectra: calculated and compared

So because we know our Cannabis absorptance data for 280 to 375 375 nm is not accurate enough I spent some time today researching the issue.

The adaxial (top surface) epidermis layer of a leaf is a major factor in terms of the absorptance of UV range light. In general, the thicker the epidermis the greater the UV-B and UV-A absorptance.

The study I used* looks at this very issue for 6 different higher plant genera. And one studied genus, Kalanchöe, has leaf adaxial epidermis of similar thickness to Cannabis. So we're using that genus as a gauge for UV-B and UV-A absorptance of Cannabis leaves as effected by their adaxial epidermis thickness.

* Ultraviolet Radiation Reflectance, Transmittance, and Absorptance by Plant Leaf Epidermises
https://www.soils.org/publications/aj/abstracts/67/5/AJ0670050720

I looked for a long time and didn't find any data regarding adaxial leaf epidermis thickness for Cannabis (hemp or drug). So I calculated it myself for from the following image. Here is the first we know of Cannabis leaf epidermis thickness data, my edits are in green font:


The above figure shows that the adaxial leaf epidermis for Cannabis is a ballpark thickness of 0.019 to 0.023 mm. However, it's probably best to assume something like 0.020 mm +/- 0.05 mm.

And adaxial leaf epidermis of Kalanchöe studied in this research was 0.016 mm +/- 0.06 mm.

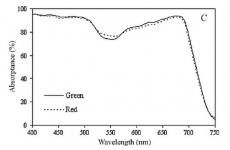
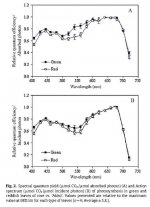
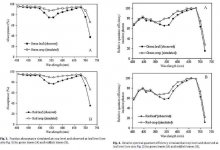
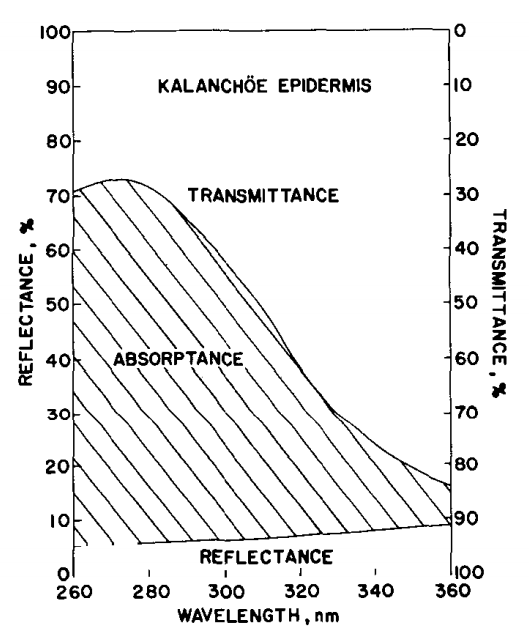
Here is the abaxial (under side) leaf absorptance spectra for Kalanchöe from that study I cited. That genus as studied for that research had absoprtance of 64.9% at 260 nm (UV-C), 65.8% at 280 nm (start of UV-B), 31.3% at 320 nm (start of UV-A), and 7.5% at 360 nm (middle of UV-A).


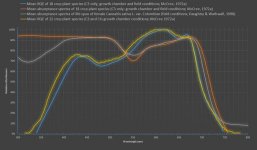
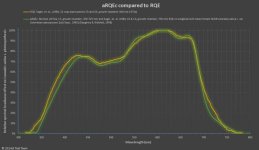
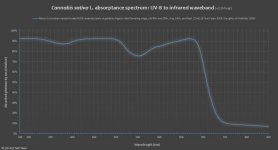
So given the above, we think our UV-B and UV-A absorptance spectra errors are too great. Therefore we're going to try to correct the values. I'll leave the current UV to IR absorptance spectra up I uploaded a few posts ago, and replace it once we update with more accurate figures.


Here's the online source of that image I used of the Cannabis leaf:
http://www.kbg.fpv.ukf.sk/studium_materialy/morfologia_rastlin/webchap10epi/10.5-2.htm
.
 
Last edited:

HUGE

Active member
Veteran
Next question, and it may be akin to asking what gods hair color is but here goes.
Now that we "know" the "absorptance leave" of each nanometer range of light energy. Can we remove the spectra absorbed as non photogenic or morphogenic response. Create a curve illustrating the uptimum "usable" spectra opposed to the "total absorbed" spectra.
 
-------------
EDIT 10/14/2014:
Final version 3.0 of the absoprtance spectra is found here:
https://www.icmag.com/ic/showpost.php?p=6601485&postcount=141
-------------

Here's an updated version of the absorptance spectra for 280 to 850 nm waveband. We'll keep working on this to see if we can increase UV waveband accuracy, as we find more useful data.

This version (2.0) has increased accuracy for 400 to 850 nm waveband. Now that range is quite accurate to the mean data from the study in the first post of this thread.

We think around +/- 1% error margin is a safe assumption for the abosrptance spectra from 400 to 850 nm. So for example, 91.91% could really be somewhere between 90.99% and 92.83%.

This version also has improved accuracy for UV-B and UV-A absorptance spectra. We think less than +/- 10% error margin is safe assumption. For example, the line may be more flat over the whole UV range (hewing around 90% absorptance).

Here is how these data were created with math:

1. - Used our spreadsheet posted in the second post of this thread to calculate the absorbance spectra by 1 nm step size for the four test dates in 1995 (July, Aug., and Sept.), 400 to 850 nm waveband. Then calculated their mean by nm.

2. - Used cubic spline interpolation to calculate 2 nm step size values for 400 to 850 nm waveband from the 1 nm step size from step 1. Rounded up to ten thousandths place when appropriate.

3. - Used cubic spline interpolation to calculate 2 nm step size values for 350 to 398 nm waveband from 25 nm step size values extracted from step #2 result (from 400 to 850 nm).

4. - Used Gaussian smoothing with Sigma of 2 to smooth the noisy data below 400 nm from step 3 (from 350 to 398 nm).

5. - Added 350 to 398 nm waveband from step 4 to 400 to 850 nm waveband from step 2, to create 350 to 850 nm waveband by 2 nm step size.

6. Extracted 25 nm step size values from step 5 result, from 400 to 850 nm, and included value from 368 nm, and then used cubic spline interpolation to create absorptance values for 280 to 348 nm by 2 nm step size.

7. - Added 280 to 348 nm waveband from step 6 result to step 5 result, to create 280 to 850 nm waveband absorptance spectra.

8. Finally, used Gaussian smoothing with Sigma of 6 to smooth the noisy data from 320 to 400 nm from step 7 result.

9. Made the following graph from step 8 result:
 
Last edited:
Next question, and it may be akin to asking what gods hair color is but here goes.
Now that we "know" the "absorptance leave" of each nanometer range of light energy. Can we remove the spectra absorbed as non photogenic or morphogenic response. Create a curve illustrating the uptimum "usable" spectra opposed to the "total absorbed" spectra.
I'm not sure I understand what you're asking exactly, but I suspect maybe I do: various action spectrum?

For example, the PAR range action spectrum of photosynthesis (McCree), far-red/IR action spectrum of photosynthesis, light action spectrum of cannabinoid biosynthesis (we plan to find out if such a thing exists ), etc. Is that what you mean?


The reason we're doing all this work for the Cannabis absorptance spectra is so we can use it in our spreadsheet for useful metrics like what you seem to be asking for. By itself the absorptance spectra is not really useful, it's interesting, but not really useful.

So for example, with our spreadsheet we're using the Cannabis absorptance spectra we made to calculate the following metrics for lamps. Using these metrics we can say if a lamp (or system, the lamp + ballast) is likely to be better for Cannabis growth vs. a different lamp, or more energy efficient (i.e. turning joules into photons).

YPF/PPFD ratio (aka YPF/PPF ratio) for radiant energy:
The greater this ratio the better the light is likely to be in terms of higher rates of photosynthesis vs. a lamp with lower YPF/PPFD ratio (if both lamps were used at the same PPFD, for example). So generally a lamp with higher YPF/PPFD ratio is better for plant growth (in terms of photosynthesis).

YPF is calculated using RQE (relative quantum efficiency). And RQE is the action spectrum of photosynthesis divided by absorptance at each nm (McCree, 1972a). So, these Cannabis absorbance spectra data we've created at every 2nd nm from 280 to 850 will be used to adjust McCree's RQE for Cannabis absorptance.

This means the YPF/PPFD ratio in our spreadsheet that is reported for each lamp will be geared for Cannabis, rather than just using the non-Cannabis adjusted YPF from McCree.

So the YPF/PPFD data (which we call "YPFc" so, YPFc/PPFD) is specific to Cannabis. The greater that ratio the better the lamp is likely to be for plant growth.

Furthermore, we used McCree's data for action spectrum of photosynthesis and leaf absorbance to create a brand new YPF that includes only C3 plants, comprised of 18 different species, both plant growth chamber and field conditions. We did this because the YPF generally used for lighting includes 4 species of C4 plants, and Cannabis is a C3 plant.

So in this way the YPFc we've created is considerably better than normal YPF, because it's weighted for Cannabis absorptance and only includes C3 plants, like Cannabis.

YPF (and YPFc) is simply PPFD weighted with RQE (relative quantum efficiency). Which means YPF is PPFD adjusted to reflect each nm's relative ability to drive photosynthesis.

RQE is calculated as the action spectrum of photosynthesis divided by absorptance at each nm and normalized to 1. Therefore to adjust RQE for Cannabis, all we have to do is divide RQE by McCree's absorptance at each nm, and then multiply by our Cannabis absorptance at each nm.

However, McCree’s work for YPF has some issues when we try to apply it for high irradiance white (or simple polychromatic) light. But even though it’s not perfect, it’s still useful and better than nothing. This is why it’s important to focus on PPFD, but also paying attention to YPFc is a really good idea, just don’t choose YPFc over PPFD.

YPFc/PPFD ratio for irradiance:

Used to calculate YPFc from PPFD, so a grower can tell how much light weighted for Cannabis photosynthesis is at the spot of measurement (e.g. canopy). For growers using a quantum sensor.

YPFc/Klm ratio for irradiance:
Used to calculate YPFc from lux, so a grower can tell how much light weighted for Cannabis photosynthesis is at the spot of measurement (e.g. canopy). For growers using a lux meter.

YPFc/joule:
This is a metric about energy efficiency of the lamp and the system. This says for every input joule per second (i.e. watt) the lamp (or system) emits X YPFc (as umol/m-2/s-1).

This is also stated as (radiant) PPF/joule. That is, for every input joule/s the lamp emits X umol/m-2/s-1.

In terms of energy efficiency, the greater the YPFc/joule and PPF/joule values the more efficient the lamp and system. Saving money on the electric bill.

Absorptance coefficient:

This means out of the total energy in the studied waveband, e.g. all photons in PAR range (PPFD), x% is absorbed. The greater the coefficient the less 'wasted' light, because more of it is absorbed by the plant.

This is useful to compare lamps in terms of how much of their emitted light is used by the plants. A lamp with a higher value could be a better choice vs. one with a lower value.

And we've made two coefficient ranges: PAR (400-700) and EM (280-850 nm, or as much info as the SPD provides).

Far-red/IR action spectrum of photosynthesis:
Recently (the past decade or so) there has been pub lied research quantifying the quantum yield (action spectrum of photosynthesis x absorptance at each nm) of far-red and IR light.

We are going to use those data the same way we're using McCree's quantum yield data. That is, we're going to adjust that far-red/IR quantum yield response spectrum with Cannabis absorptance.

Then, we're going to normalize that new far-red/IR quantum yield response weighted for Cannabis (rather than sunflower) to McCree's quantum yield of photosynthesis (for PAR light). Which will give us a 348 to 850 nm relative quantum efficiency (RQE) curve weighted to Cannabis :)

That new 348-850 nm RQE geared to Cannabis is a 'wide' version of the YPFc I mentioned earlier. So in that way we have two ranges for the lamps effect on Cannabis photosynthesis:
PAR RQE (400-700 nm)
Wide RQE (348 to 850 nm)

And we will use the Wide RQE the same way as the PAR RQE, for calculating "YPFc" and "YPFc Wide."
 
Last edited:
-------------
NOTE 10/14/2014:

Final version 3.0 of the absoprtance spectra is not shown below, that's v2.0. Version 3.0 of the absoprtance spectra is close to flat at 90% from 280 to 400 nm, v3.0 is found here:
https://www.icmag.com/ic/showpost.php?p=6601485&postcount=141
-------------

HUGE:

I wanted to try to express what I wrote about our YPFc in the post above in a graph. Remember that YPF is RQE multiplied by PPFD at each nm, then summed over PAR range, and RQE is the action spectrum of photosynthesis divided by abortance at each nm and normalized to 1.

The following graph shows the differences between the normal RQE (yellow line) used to calculate YPF for horticulture and plant science light measurement relating to photosynthesis, and the RQE (blue line) we're going to adjust with Cannabis absorptance spectra (gray line) to calculate YPFc.

As well as the differences between the absroptance spectra (orange line) used to calculate that normal RQE (yellow line) and the Cannabis absorptance spectra we calculated (gray line), that we will use calculate RQEc (so we can calculate YPFc).

We haven't yet created the modified RQEc, which is done by divding the yellowing line by the organe line, then mutliplying by the gray line.

Please ask again if this aren't clear.

(Sorry the yellow line is so square, those data are from Sager, et. al., 1988. I could re-calculate Sager's work and correct the graph if you'd like to see it a little more refined.)


Attachments

  • RQE and absorptance (McCree and Daughtry-Walthall).jpg
    RQE and absorptance (McCree and Daughtry-Walthall).jpg
    37.4 KB · Views: 19
Last edited:
One point about the absorptance spectra we're creating for Cannabis and the one I presented from McCree:

In the above post the orange line (absorptance spectra for 18 species of C3 crop plants) extends well past 1,000 nm (less than 5%, likely), just like Cannabis (gray line). But the absorptance spectra data set given by McCree only lists 350 to 750 nm, so the cubic spline interpolation we did of that data set ended at about 748 nm. While the data set we created from Daughtry & Walthall's work is 400 to 850 nm.

Likewise, the yellow and blue lines really extend beyond (less than) 350 nm and (greater than) 700 nm. But the RQE data given by McCree only lists 350 to 725 nm, and he didn't see much action for photosynthesis above 700 nm (even though more recent reserach suggests otherwise).
 
Last edited:

Ranger

Member
nice work on the data BTT, seems to show cannabis isn't your average C3 plan now is it. what i'm getting is cannabis seems to prefer the blue end over the red end (comparatively) but can utilize the red end when needed. cannabis also seems to not utilize 550 very well while the average of other C3 plants are and also still climbing into the 600 nm area.

i'm assuming the "color" our eyes are seeing when we look at cannabis must certainly be around the 550 nm mark, since they reflect and use very little of it.

something that intrigues me is could there be a significant difference in absorption among different colors of cannabis plants. I.E. very dark and or purple chemo types. if they are purple to the naked eye, that tells me they are reflecting that wavelength more so than a green chemo type plant would and a possible difference, or lack there of, could be useful to a grower.
 
Thanks. It took a bit of head scratching (and more time than I would have liked) to make it down to 280 nm. McCree only gave data by 25 nm step size, so for absorptance that's 350 nm, 375 nm, 400 nm, ... 750 nm. And we had to use interpolation to get all the other data points (at 2 nm step size).

Yup, Cannabis absorbs blue range considerably more efficiency than red range. Red range has greater transmittance than blue range. Though red range still produces slightly greater quantum yield per photon per nm than blue range.

I think that graph speaks to lots of non-photosynthetic reactions taking place from blue range light, as well as photosynthetic. Somewhere in the ballpark of 20% of blue light absorbed is used for non-photosynthetic processes. Very good research by Dr. Bugbee and others (and his students) have found a ballpark minimum requirement of around 8% to 10% blue light, out of total PPFD, for healthy plant growth. However, that's only the minimum...

I too found it interesting how the mean absorptance spectra for 18 C3 species is different than Cannabis in interesting ways. And that Cannabis absorbs more green light (at around 550 nm) than those 18 other species, as well as less red to far-red (about 675 to 750 nm).

Yup. Cannabis looks green because that's the most reflected wavelength range, between about 9% to 15.75% (transmittance is between 5% and 10.5%). It's amazing that in the 21st century people still claim plants don't use green light.

Great point about the purple leaves. Likely flavonoids are at play (greater concentration), so possibly greater blue (e.g. 425 to 500 nm), green, and red range absorptance, as well as UV range vs. green leaves.

Also worth pointing out is (generally) all green plant organs can carry out photosynthesis, and most of them absorb photons. So petiole, stem, and even flowers absorb photons and can carry out photosynthesis. The absorptance spectra we've created is only for the leaves, though.

In case you're curious, here are the 18 C3 species we extracted from McCree's work to create that absorptance spectra (orange line) and RQE (blue line):

Wheat (Triticum aestivum L.)
Barely (Arena sativa L.)
Oats (Hordeum vulgate L.)
Triticale (Triticum durum × Secale cereale L.)
Rice (Oryza sativa L.)
Sunflower (Helianthus annuus L)
Soybean (Glycine max L.)
Castor bean (Ricinus communis L.)
Peanut (Arachis hypogaea L.)
Lettuce (Lactuca sativa)
Tomato (Lycopersicon esculentum)
Radish (Raphanus sativus)
Cucumber (Cucumis sativus L.)
Muskmelon (Cucumis melo L.)
Squash (Cucurbita pepo L.)
Clover (Trifolium repens L.)
Cotton (Gossypium hirsutum L.)
Sugar beet (Beta vulgaris L.)
 
Last edited:

DooDahMan

New member
I signed up especially for this thread to get advice on light.

By now I got me 2 UVC 24 watt PLL's and the 120 watt MegaRay you discussed before and I still need ~430 watt for the par white to get 600 watts total. What would you recommend?

Thanks in advance for all your great information, I am looking forward to surprise my friends that still use outdated HPS :woohoo:
 
I think maybe I wasn't clear or you misunderstood what this thread is about, and what I wrote about that UVB lamp.

I don't have suggestions for you on lamps, and that's not what this thread is about. That's what our spreadsheet will assist with (but it's not ready yet, and when it is I'll start a new thread). Other than we think some brands are better than others.

I didn't suggest using the MegaRay. I hope you didn't buy it from what I wrote about its UV-A output relative to its UV-B output.

I'm not sure what you mean by needing 600 watts, but again, this probably isn't the best thread to ask about how to irradiate your garden. There are lots of other threads that are better suited than this one.

UV-C is not something you will want to provide you plants in terms of irradiance. And it's dangerous for you, too. I wouldn't say HPS is outdated, it's still the most efficient HID light source and Cannabis does well with HPS.

I hope you're able to find the answers you seek in other threads, good luck. And welcome! :)
 

DooDahMan

New member
I didn't suggest using the MegaRay. I hope you didn't buy it from what I wrote about its UV-A output relative to its UV-B output.

No, I don't understand any of that. I bought it because you said it was fine for growing cannabis, which is good enough for me.

I'm not sure what you mean by needing 600 watts

For the space of my room.

UV-C is not something you will want to provide you plants in terms of irradiance. And it's dangerous for you, too.

But it is something we want right, since the plants use about 65% of it? Do I still need more of it given the rest of my set up?
The UVC I got was designed for swimmingpools so I hope that is safe.

I hope you're able to find the answers you seek in other threads

I am not so optimistic, only you have this information and done that research.
 
D

Drek

Extra red is not necessary to induce flowering or improve flowering, and if it's far-red it's likely unhelpful. Well, that's assuming it's for the photo-period and not for night-break.

The light spectrum from the sun does not change considerably throughout the season. That's the misunderstanding that is the base of the myth that MH is for veg and HPS is for flowering (which is mostly found in Cannabis growing forums).

Thank you. I've been voicing (more or less) this same opinion on this very notion for the last 7 months. HPS is a great source of light apart from the fact that you can't see shit with it, in terms of one's responsibility to your plants, as a gardener. 3-4k artificial temp, imo, pretty closely matches mid-day to evening sun, regardless of the time of year. Plants see tons of blue light during flowering.

Here's a statement sure to cause some controversy:

Lighting is overrated. :ying:
 
HUGE (and others):

I was thinking about how to more fully explain action spectrum relating to your question. In a very basic explanation, an ‘action spectrum’ means the effect on a system (such as photosynthesis, stomatal opening, flavonoid biosynthesis, etc.) from light (normally photons flux or reciprocal of photon fluence) at X wavelength nm (or small waveband) to produce Z system response (which is then listed at its 50% saturation point).

Here is a good explanation of action spectrum (for various types of organisms), and how they're created. This is pretty heavy in specifics: http://www.photobiology.info/Gorton.html

So as a good example of what we plan to do:

Now that we created the Cannabis absorptance spectra, all we have to do is use a photosynthesis meter to quantify the action spectrum of photosynthesis for Cannabis to create a Cannabis specific RQE to weight PPFD. :)

Creating the action spectrum of photosynthesis is done (at least how we'll do it) by attaching the photosynthesis meter clips to multiple leaves for approximate whole plant, as well as individual leaf, to quantify the action spectrum of photosynthesis, for whole plant and single leaf. We are going to use monochromatic light and white light (to verify the monochromatic light values) at high irradiance typical of Cannabis growth chamber and field conditions.

However, because the absorptance spectra we created was from field grown Colombian female drug biotype plants, we will quantify absorptance in 2015 as well as action spectrum of photosynthesis, for various genotypes and growth stages. For this we won't be able to make as accurate data as Daughtry and Walthall (1998), but we will be able to make an approximation that we can use with our current absorptance spectra (from Daughtry & Walthall, 1998). Ideally we'll buy a spectroradiometer for this, so we can also then create SPD's for various lamps from UV or IR.

Then, once we have the Cannabis action spectrum of photosynthesis, all we have to do multiply those values (by nm) with the absorptance values (by same nm), and normalize to 1, to create a Cannabis specific RQE. Which is then used to very accurately weight PPFD for Cannabis use of light for photosynthesis. This means we're doing for Cannabis what McCree did for 22 other genera back in 1972.

We also plan to study at various ages and growth stages, as well as nutrient status (e.g. low N), and effect on photosynthesis over the whole day vs. single measurement.

All of this is not hard at all. The only thing holding us back is lack of a photosynthesis meter, luminaire, filters, and spectroradiometer (and other equipment), which should be resolved in 2015 (we hope).
 
Last edited:
something that intrigues me is could there be a significant difference in absorption among different colors of cannabis plants. I.E. very dark and or purple chemo types. if they are purple to the naked eye, that tells me they are reflecting that wavelength more so than a green chemo type plant would and a possible difference, or lack there of, could be useful to a grower.
Something you may like, I found it very interesting. It finds the differences are small for absorptance and photosynthesis, at least in reddish rose leaves vs. green rose leaves:


Spectral dependence of photosynthesis and light absorptance in single leaves and canopy in rose
http://www.sciencedirect.com/science/article/pii/S0304423810005212

Abstract

Little is known about the effects of leaf pigmentation (related to leaf ontogeny), on the spectral dependence of photosynthesis and most observations have been limited so far to single leaves. This study aimed to investigate photosynthesis and the related optical properties of two types of rose leaves, young reddish leaves and middle age green leaves, and to quantify the spectral dependence of photosynthesis at the canopy level.

Photosynthesis was measured with CO2/H2O gas analyzer on intact leaves of rose ‘Akito’ at narrow band light of 18 wavelengths. Subsequently, the optical properties (transmittance, absorptance and reflectance) were measured with spectrophotometer. A mechanistic crop model was used for up scaling measurements at the single leaf level to the crop level (crop with LAI = 3).

The green and the reddish leaves had similar total PAR absorptance, even though absorptance around 550 nm was slightly lower in the green leaves. The maxima of photosynthesis efficiency were at 640–680 nm for quantum yield (per absorbed light unit) and at 660–680 nm for action spectrum (per incident light unit), regardless the colour of the leaf blade. In the range 500–580 nm, both the quantum yield and the action spectrum were lower in reddish than in green leaves. Differences in optical properties and photosynthetic behaviour were related to the higher content of anthocyanins in red leaves.

The spectral dependence of light absorption and photosynthesis at the canopy level differed distinctly from that at leaf level. The spectral differences in absorption at the leaf level almost disappeared at the canopy level. Consequently, while the action spectrum of green light (520–570 nm) was only 67% of that of red light (680 nm) at the leaf level, it increased to 79% at the crop level.

Young reddish leaves had higher absorptance but lower action spectrum and quantum yield at green light. Spectral differences in photosynthesis at the canopy level are much smaller than at the leaf level. Our short term measurements suggest that optimizing spectral output of LED lamps may increase photosynthesis up to 12% for a canopy with green leaves and up to 17% for a canopy with reddish leaves when compared to the spectrum of HPS lamps.
 

Attachments

  • Absorptance spectra - green and red leaves.png
    Absorptance spectra - green and red leaves.png
    25.5 KB · Views: 23
  • Action spectrum of photosynthesis - Red and green rose leaves.jpg
    Action spectrum of photosynthesis - Red and green rose leaves.jpg
    51.9 KB · Views: 23
  • RQE and fractional absorptance.jpg
    RQE and fractional absorptance.jpg
    54.5 KB · Views: 17
Last edited:
This was the final goal of creating Cannabis absorptance spectra: To adjust the defacto quantum yield of photosynthesis for better reflect Cannabis use of light for photosynthesis. As well as to weight other action spectra such as action spectrum blue light stomatal opening, action spectrum green light stomatal closing, phototropin action spectrum (e.g. phototaxis, phototropism, light tracking by leaves), phytochrome, PSII inhibition, etc.

This first graph just shows the data, these data will be used in our spreadsheet. We are only using growth chamber data, which removes two data sets from our previous graph, so we're still using 18 species, as well as Cannabis sativa. The second graph compares our data (from the first graph) with the data from Sager, et. al. (1984), which used McCree's work from 1972. See the legends in both graphs for info:


Attachments

  • aRQEc vs. RQE.jpg
    aRQEc vs. RQE.jpg
    28.9 KB · Views: 14
  • Cannabis sativa L. app. aRQEc of photosynthesis (final).jpg
    Cannabis sativa L. app. aRQEc of photosynthesis (final).jpg
    25.3 KB · Views: 26
Last edited:

Ranger

Member
Something you may like, I found it very interesting. It finds the differences are small for absorptance and photosynthesis, at least in reddish rose leaves vs. green rose leaves:


appreciate the data again BTT.

this statement intrigues me.

having trouble pasting the excerpt but i found that statement to be discussion worthy, at least among me myself and I. :biggrin:

seems they are stating that "LED" light, i'm assuming they are stating 380nm-550nm as an LED trait and 550nm- 700nm to be an "HPS" trait. and if this is correct then they seem to be saying that "green leafed" chemo types could see a poterntial increase of 12% and red leafed chemo types up to 17% with the addition of 380-550nm.

that is of course assuming they refer to LED light as potentially more blue verses HPS light which generally doesn't support the blue end of the spectrum very well.

do you feel this is what they are describing, or am i off the mark?

[FONT=Arial, Helvetica, sans-serif]Our short term measurements suggest that optimizing spectral output of LED lamps may increase up to 12% for a canopy with green leaves and up to 17% for a canopy with reddish leaves when compared to the spectrum of HPS lamps. [/FONT]
 
3rd try is the charm

3rd try is the charm

After talking about the 280-400 nm waveband between ourselves I went ahead and updated it one last time.

This update we think better reflects how Cannabis absorbs UV light than our previous two versions. The data for 400-850 nm has not changed. For 280-399 nm we think the error margin is now +/-5%. The error margin for 400-850 nm should still be less than about +/-1%.

We keep trying to make this more accurate because lots of things depend upon absopratnce (to find various quantum yields of action spectrums).

For this final version analyzing Daughrty and Walthall's work from 1998 I changed the method from last time (from v2.0)*:
* https://www.icmag.com/ic/showpost.php?p=6593407&postcount=125


1. I chose 92.5% absorptance for 280 nm reflecting the mean for 18 other C3 crop species (that we found through cubic spline interpolation of McCree's absorptance mean from 350-750 nm).

2. The mean of 280 and 400 is about 340 nm, and so I selected the mean of the absorptance value for 280 nm and 400 nm for 340 nm.

3. Used cubic spline interpolation for 2 nm step size values (280-850 nm) from the 1 nm step size values (400-850 nm) we hand calculated from the graphs in that published study. This included the two new values for 280 and 340 nm.


These data track well with the data from the study I uploaded about epidermis thickenss and other factors effect on UV absorptance (such as trichomes, hairs, etc.), as well as common UV-B and UV-A reflectance and transmittance by higher plants:


Attachments

  • Cannabis sativa L. absorptance spectrum - UV-B to infrared waveband (v3.0-final).jpg
    Cannabis sativa L. absorptance spectrum - UV-B to infrared waveband (v3.0-final).jpg
    23.3 KB · Views: 28
Last edited:

Latest posts

Latest posts

Top