What's new
  • Happy Birthday ICMag! Been 20 years since Gypsy Nirvana created the forum! We are celebrating with a 4/20 Giveaway and by launching a new Patreon tier called "420club". You can read more here.
  • Important notice: ICMag's T.O.U. has been updated. Please review it here. For your convenience, it is also available in the main forum menu, under 'Quick Links"!

Cannabis absorptance spectra: calculated and compared

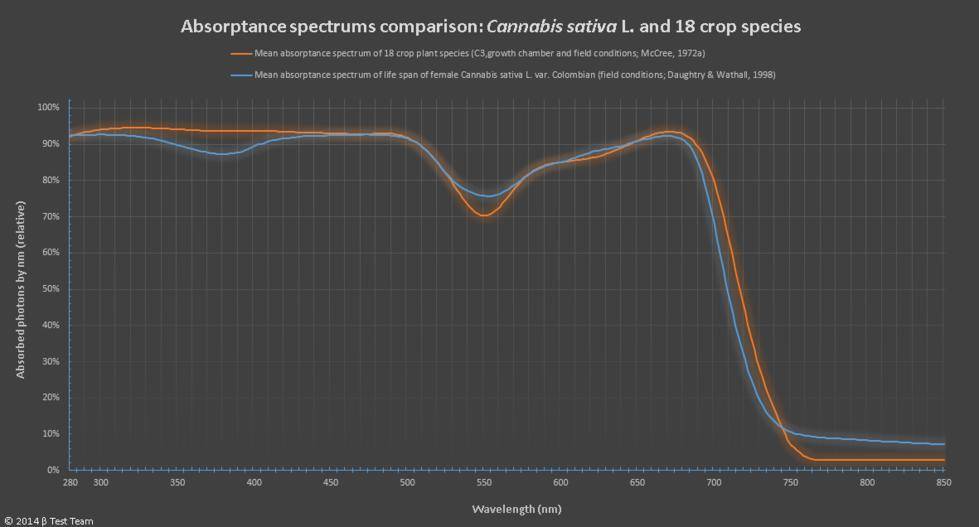
And here's the v3.0 of our absorptance for Cannabis vs. our cubic spline interpolation of McCree's absorptance for 18 C3 crop plant species.

Our cubic spline interpolation of McCree's data points (25 nm step size from 350 to 750 nm) ended at 758 nm. So I also extended the McCree absorptance by hand from 750 to 850 nm, and then used Gaussian smoothing for 750-775 to smooth out the curve.

This gives 3% absorptance for McCree's work from about 760 nm to 850 nm. We thought 3% is a good ballpark, as it could be anywhere between a likely ballpark of 1% to 8%. Without this McCree's absorptance shows 0% above about 758 and that's not what happens in real life.


Attachments

  • Absorptance spectrums comparison - Cannabis sativa L. and 18 crop species.jpg
    Absorptance spectrums comparison - Cannabis sativa L. and 18 crop species.jpg
    25.5 KB · Views: 31
Last edited:
appreciate the data again BTT.

this statement inrigues me.
[FONT=Arial, Helvetica, sans-serif]Our short term measurements suggest that optimizing spectral output of LED lamps may increase up to 12% for a canopy with green leaves and up to 17% for a canopy with reddish leaves when compared to the spectrum of HPS lamps. [/FONT]
having trouble pasting the excerpt but i found that statement to be discussion worthy, at least among me myself and I. :biggrin:

seems they are stating that "LED" light, i'm assuming they are stating 380nm-550nm as an LED trait and 550nm- 700nm to be an "HPS" trait. and if this is correct then they seem to be saying that "green leafed" chemo types could see a poterntial increase of 12% and red leafed chemo types up to 17% with the addition of 380-550nm.

that is of course assuming they refer to LED light as potentially more blue verses HPS light which generally doesn't support the blue end of the spectrum very well.

do you feel this is what they are describing, or am i off the mark?
I think you're off the mark. I uploaded the study for you, plus its sister study.

The light used to cultivate the plants in the greenhouse was sunlight plus Philips SUN-T Green Power 600W. The HPS supplemented the sunlight to ensure 150 W/-2 as a minimum irradiance (max as 250 W/m-2); 16 hour photoperiod.

And the HPS light for the photosynthesis studies a 250W halogen with filters to replicate sunlight in the visible range. From the study: "the halogen spectrum filtered with a heat filter and a filter to convert tungsten halogen light to day-light."

The other 250W halogen was for the narrow wavebands for photosynthesis study (10 nm from about 400 to 720 nm, etc.).

So I think what they're saying in the quote you cited (see page 553, section 4.4), is that if one was to custom make a LED array, choosing LEDs with higher "LUE" by narrow waveband, especially in the red waveband, the final LUE will be greater than the LUE from the "HPS" (which I take to mean Philips SUN-T Green Power 600W, see page 550, just above section 2.3).

And "LUE" (Light Use Efficiency) as they use it means two things, in terms of photosynthesis:
- umol CO2 assimilated per PPFD (action spectrum)
- umol CO2 assimilated per absorbed PPFD (quantum yield)

Also, they make the important note that they're only taking instantaneous effects of narrowband light in account (with 40 PPFD day light spectrum in the background). They did not study effects of temperature, CO2, VPD, etc., on their photosynthesis measurements.

The spreadsheet we're working on provides a similar metric to their "LUE" for rose photosynthesis. We're using our aRQEc (which is analogous to their quantum yield) to calculate a "LUEc" for Cannabis photosynthesis (analogous to their LUE) for each light source studied with our spreadsheet.
 

Attachments

  • Spectral dependence of photosynthesis and light absorptance in single leaves and canopy in rose.pdf
    905.2 KB · Views: 76
  • Light Use Efficiency at Different Wavelengths in Rose Plants.pdf
    97.7 KB · Views: 62

Ranger

Member
ah yes i see that now, they were just referring to LED comparative to HPS in a narrow band and not full spectrum.

i noticed their data suggests that there aren't many HPS bulbs that will go down to the red levels very well, stating that the bulbs they tested stayed in the green, yellow and orange range. i can see that myself in many bulbs i have tried as they appear more golden colored verses red, to the naked eye.

their data also suggests that there isn't much appreciable difference in light absorption in red verses green leaves. good info to know
 
Generalized plant action spectra

Generalized plant action spectra

Below is the list of action spectra we're using in our spreadsheet to weight the light sources (HID, LED, sun, etc.) that are analyzed with our spreadsheet. All of these are divided by our mean Cannabis absorptance spectrum at each 2 nm wavelength step (so at 400 nm, 402, nm, 404 nm, ...).

An action spectrum (in this case) describes the effect of light (photons as flux or fluence) upon a plant system (like photosynthesis or stomatal opening). Basically, most of the time an action spectrum is the amount of light that it takes to reach 50% saturation of the system by wavelength (or narrow-band range). So in the example of the action spectrum of photosynthesis (McCree), the action spectrum shows the relative amount of light (photon flux) per nm (wavelength) needed for the leaf to reach less than its peak rate of photosynthesis (saturation) at each nm.

Action spectra are used to calculate quantum yields for the various systems, such as photosynthesis. Quantum yield (QY) is found (in most cases) by dividing the action spectrum by absorptance at each nm. Relative quantum efficiency (RQE) is found by normalizing QY to 1. Then RQE (in our case, what we call aRQEc) is used to multiply by the photons at each nm for the light source being analyzed.

For example, light source A with greater value for action spectrum X may be a better choice than light source B with a lower value for action spectrum X. And likewise, light source A with greater value for action spectrum Y may be a worse choice than light source with B with lessor value for action spectrum Y.

Action spectrum represent beneficial and not beneficial effects from light, like the phototropin action spectrum (beneficial to the plant) and the UV plant growth action spectrum (not beneficial to the plant).

One important point to make is all of these action spectra are not for Cannabis, though most of them are generalized (the mean of many species). So the results from our spreadsheet will be approximate to the real reponse from Cannabis. It's approximate because we only weight the action spectra from other species (focusing on C3) by Cannabis absorptance. (We have plans on the back burner to create various action spectrum and quantum yeilds for Cannabis.)

The action spectra list (we're taking suggestions if anyone has input):

We'll go into detail about each action spectrum in the thread for our spreadsheet, once it's completed.

1. Photosynthesis (CO2 fixation)
2. Far-red photosynthesis (O2 evolution)
3. Phytochrome (A & B, 'red-light responses')
4. Phototropin (1 & 2, 'blue-light responses')
5. Blue light stomatal opening
6. Green light stomatal closing (i.e. reversal of blue light stomatal opening)
7. PSII photodamage (i.e. UV and yellow light photoinhibition)
8. (maybe) PSI and PSII excitation (for PSI:pSII ratio; regarding photosynthesis)
9. UV for plant growth inhibition
 
Last edited:
We have cryptochrome action spectra (cry1 and cry2). We were thiking about not including those spectra. But it may be a good idea after all...

Because cryptochrome effects photoperiodism, flower induction, circadian rhythm, DNA damage photorepair, internode length, etc., we do want to include the action spectra. The cry2 degradation action spectrum is a "representation of wavelength sensitivity of cry2 activation."

We also really want a “diaphototropism” action spectrum (i.e. light tracking by leaves), but currently no good ones exist. This is a well-known hole in plant photobiology knowledge.

Evidence of a Light-Sensing Role for Folate in Arabidopsis Cryptochrome Blue-Light Receptors

http://mplant.oxfordjournals.org/content/1/1/68.long (Cry2)

Action spectrum for cryptochrome-dependent hypocotyl growth inhibition in Arabidopsis
http://www.ncbi.nlm.nih.gov/pmc/articles/PMC161700/ (Cry1)
 
Last edited:
Oh yea, I forgot to metion the action spectra of 'DNA photolyases for photorepair' (photoreactivation for sorghum and cucumber). This is about light use by plants to repair DNA damge by UV-B light, for example.
 
Last edited:

DooDahMan

New member
I am trying to use your spectrum here, but I really need some help as I don't understand any of this (I just look at the pictures like a comic book:)).
My lighting set up now is 2 x 24 watt UVC PLL, 1 x MegaRay 120 watt UVB and 2 150 watt CFL's, but I already have the Philips 315 watt CMH (the one that was discussed before) to replace these.
Unfortunately it can't be put in yet untill I turn of the lights, because they are very hot, but after the seeds come up I will switch them.

What I need to know is how to correctly make the full spectrum and if I need more UVC. The Philips CMH got quit a bit of UVC too, so I'll have more after I put that in. The room is 9 square feet.
 
Bubbleblower, I know that's you. You're not fooling anyone. Please stop. And go ahead and make another new account and the same result will happen (as well as you'll rate this thread down again, I'm sure).

By the way, you wrote that you just very recently purchased that MegaRay lamp, yet, they're on back-order and as far I know cannot be purchased in the US at this time.
 
Last edited:
You're welcome, and thanks. That final aRQEc graph I posted* is wrong, though (but not much different when corrected). We multiplied when we should have divided. We already made updated aRQEc graphs we'll post when the spreadsheet is ready (soon I hope!).

And just to get the spreadsheet out sooner rahter than later, we're only including the following action spectra (as RQE for each) in the pre-alpha release. All of these are complted except for phototropin, blue, and green stomatal openeing and closing (those last three will take only a few hours).

Action spectra:

Photosynthesis for indoor plants
Photosynthesis for outdoor and greenhouse plants
Phototropin
PSII photoinhibition
Blue light stomatal opening
Green light reversal of blue light stomatal opening
Phytochrome photochemical cross-section red absorbing state (for phytochrome photo-equilibrium calculation)
Phytochrome photochemical cross-section far-red absorbing state (for phytochrome photo-equilibrium calculation)

* https://www.icmag.com/ic/showpost.php?p=6599942&postcount=137
 

growkindness

New member
@Beta Test Team - What is your opinion of companies that are using a phosphor coating on blue leds to arrive at a given spectrum? Some examples are

Smart Grow Technologies

Total Grow

Max Grow Lights

I've been using mixed spectrum lights with pretty good success but was wondering if there is merit to the claims of utilizing a phosphor coating to arrive at the "perfect" spectrum for growth.

Thanks for all of the info you've posted, great stuff!
 
growkindness:

Sorry, but I'm not the right person to answer those questions, as I don't know the answer and I doubt my colleague does either. Though, I would say that there is no perfect spectrum because too many factors affect how plants respond to, and use photons.

I think if you asked in a better place, like the LED forum, you would get assistance.
 
That final aRQEc graph I posted* is wrong, though (but not much different when corrected). We multiplied when we should have divided.

* https://www.icmag.com/ic/showpost.php?p=6599942&postcount=137
For those interested I'm going to write a thread tomorrow with the updated (corrected) graphed RQEs of Cannabis of photosynthesis (growth chamber and field conditions). And also upload some other graphed RQEs of Cannabis, like phototropin response and stomatal opening and stomatal closing.

That thread is found here:
https://www.icmag.com/ic/showthread.php?t=298468
 
Last edited:
Just came across a study published in 2011 that deals with pigment (chemical) absorbance (not the same thing as leaf absorptance, but close) of Cannabis (hemp), as monoecious and dioecious cultivars.

What I found interesting is the finding that UV-A (specifically 320 nm), where UV-B is 280-319, and UV-A is 320-399, has among the greatest absorbance (depending upon location, and therefore age, of leaf samples). I think this helps to validate our Cannabis absorptance spectrum where we theoretically (using math) created Cannabis UV-A and UV-B absorptance.

For a quick explanation of the difference between chemical absorbance and physical absorptance, here's Wikipedia:
In spectroscopy, the absorbance (also called optical density) of a material is a logarithmic ratio of the amount of radiation falling upon a material to the amount of radiation transmitted through the material. Absorbance measurements are often carried out in analytical chemistry.

In physics, the term spectral absorbance is used interchangeably with spectral absorptance or absorptivity. In this case it has a slightly different meaning: the fraction of radiation absorbed at specific wavelengths.
These data are from field grown hemp, the dioecious cultivars (what we're interested in) are Lovrin 110 and Lovrin 200. Here's a quote from the study:
The evaluated pigments were: chlorophyll a 663, for appreciating the photosynthesis in the reaction center, chlorophyll a 430 and chlorophyll b 453, components of the absorption center within the photosynthetic systems and the flavonoids with maximum absorption in the close UV radiation zone, pigments that have protective properties to stress factors.
picture.php

The research paper is free:

"Foliar Pigments and Thier Dynamics During Different Vegetation Phenophases in Five Cultivars of Cannabis sativa L."
http://www.revagrois.ro/PDF/2011/paper/2011-54%281%29-7-en.pdf
 

shaggyballs

Active member
Veteran
Thank you for continuing to share beta team :respect: I find light's effect on plants fascinating.

:respect:I have to say I totally agree here....never knew there was so much to know...LOL
I thought I was cool, cause I was walkin' round talkin' PUR.... but lets not get into that.:respect:
 

Latest posts

Latest posts

Top