Beta Test Team
Member
Hello from β Test Team
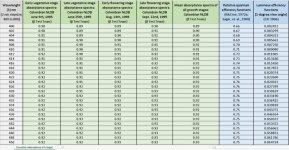
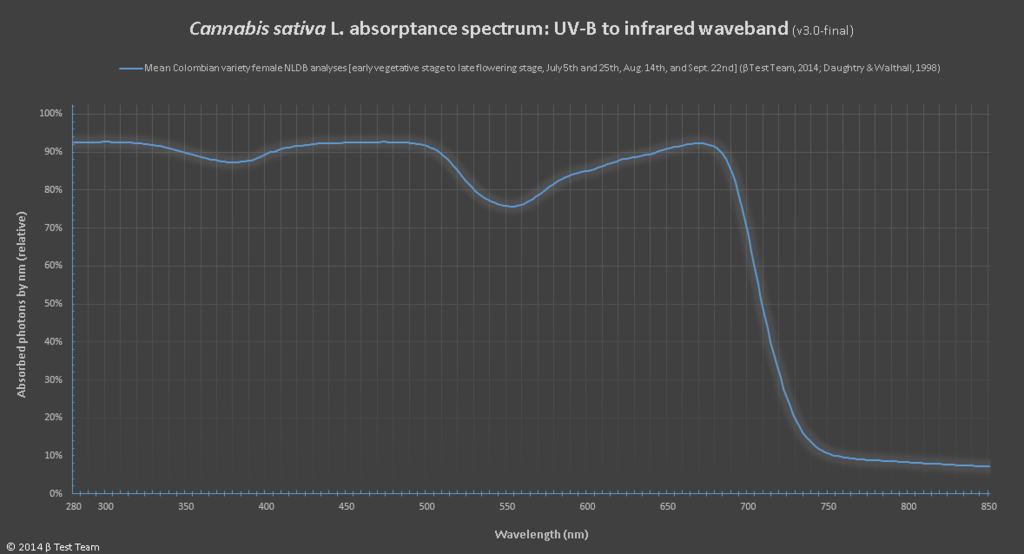
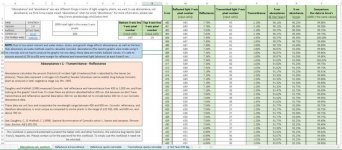
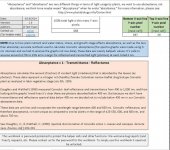
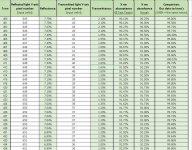
We calculated Cannabis absorptance from 280 to 850 nm, and also compared that (per nm) to knna's Cannabis absorbance spectra (Google "Bulbs comparison tool").
This is part of a larger data set we're creating that can be used to analyzed lamps (including LED) in terms of how well they may grow Cannabis (or other plants).
For this specific thread, the absorptance shows us the photons absorbed by Cannabis leaves at each wavelength nm. So if you look at the graph we made in the second post you can see our line (blue) is absorbed photons per nm, and the other line is generally how most higher plants use photons per nm for photosynthesis.
In other words, not all absorbed photons are used for photosynthesis, they're used for other things too, like photomorphogenesis, cryptochrome, phytochrome, etc. For example, about 80% of blue photons absorbed by leaves are used for photosynthesis, so blue is about 20% less efficient in driving photosynthesis than red range photons, even though leaves absorb more blue photons than red photons.
So that people can see what we did is used for, we graphed our new Cananbis absorptance spectra against the McCree RQE spectra for higher plants, as adapted by Sager, et. al.
RQE is a function used to calculate YPF from PPF (umol/m-2/s-1) per wavelength nm, and YPF is basically how well each wavelength nm photons' drive photosynthesis.
This gives a good visual of the data we made, and how it can be used to correct McCree's YPF (yield photon flux - as adjusted by Sager, et. al.) for Cannabis usage of light. (Like what knna did with his data; but we're using different data sets).
We can easily plot SPD graphs (after they're digitized) into the following Cannabis absorptance & RQE graph, showing how it may be used by Cannabis in terms of the lamps' spectral quality. Like how lamp companies like Hortilux make their SPDs, but this includes Cannabis absorbance.")
We hope this makes things clear:
We calculated Cannabis absorptance from 280 to 850 nm, and also compared that (per nm) to knna's Cannabis absorbance spectra (Google "Bulbs comparison tool").
This is part of a larger data set we're creating that can be used to analyzed lamps (including LED) in terms of how well they may grow Cannabis (or other plants).
For this specific thread, the absorptance shows us the photons absorbed by Cannabis leaves at each wavelength nm. So if you look at the graph we made in the second post you can see our line (blue) is absorbed photons per nm, and the other line is generally how most higher plants use photons per nm for photosynthesis.
In other words, not all absorbed photons are used for photosynthesis, they're used for other things too, like photomorphogenesis, cryptochrome, phytochrome, etc. For example, about 80% of blue photons absorbed by leaves are used for photosynthesis, so blue is about 20% less efficient in driving photosynthesis than red range photons, even though leaves absorb more blue photons than red photons.
So that people can see what we did is used for, we graphed our new Cananbis absorptance spectra against the McCree RQE spectra for higher plants, as adapted by Sager, et. al.
RQE is a function used to calculate YPF from PPF (umol/m-2/s-1) per wavelength nm, and YPF is basically how well each wavelength nm photons' drive photosynthesis.
This gives a good visual of the data we made, and how it can be used to correct McCree's YPF (yield photon flux - as adjusted by Sager, et. al.) for Cannabis usage of light. (Like what knna did with his data; but we're using different data sets).
We can easily plot SPD graphs (after they're digitized) into the following Cannabis absorptance & RQE graph, showing how it may be used by Cannabis in terms of the lamps' spectral quality. Like how lamp companies like Hortilux make their SPDs, but this includes Cannabis absorbance.
We hope this makes things clear:
Last edited:
 for sharing all this with the community. Personally looking forward to mulling over more of your data.
 Thanks beta