What's new
  • As of today ICMag has his own Discord server. In this Discord server you can chat, talk with eachother, listen to music, share stories and pictures...and much more. Join now and let's grow together! Join ICMag Discord here! More details in this thread here: here.
  • ICMag and The Vault are running a NEW contest in October! You can check it here. Prizes are seeds & forum premium access. Come join in!

Short term trades in the stock market •$$$$$•

Sam the Caveman

Good'n Greasy
Veteran
Futures are - more risky and are like a fuse with an expiration date ... a much sharper game ... provide less chance for error ... and to recover from an error than owning equities

Buy low ... sell high ... stay diversified

Buy the best companies you can ... never chase the market ... know your stocks ... wait for your pitch

Stick to what you know

No one ever died from a profit

Sundance

2vb3ec7.jpg
 

Sundance

member
Hahahaha Sam - funny post

Its a tough game

A lot of truisms in what I last said ... some of it funny - it comes from many years in the market

But - what I said - is all true

Stick with what you know ... know your stocks ... and try to buy them right

Dont have to be a caveman to succeed - just trade intelligently

With all that is going on at this moment with the debt talks - Monday's opening will be quite interesting

I dont think we go down the path of a downgrade - buy stocks of the best companies on weakness in the market
 

bs0

Active member
So it might be foolish, but I have a plan for monday.

Wake up early and read the news. Wait for it to open and then see what direction things are headed. It should go pretty good in one direction or the other right? And pending the direction of the market I'm going to give either QLD (if the market is going up) or QIM (if the market is going down) a shot. Both are leveraged nasdaq etf's.

Then just use a 3% trailing stop. Is this plan flawed? I would be thrilled with 3%+ progress, but accepting of a 3% loss.
 

Sam the Caveman

Good'n Greasy
Veteran
Alright Sundance, it sounds like good advise for a fundamental long term investor, exactly what I am not. I am a short term technical speculator. Your advise is useless to me, however it may be good for someone who is a long term fundamental investor.

I use intraday technical analysis and make 5 to 15 trades per day. I analyze volume, trend lines, support, resistance and moving averages, particularly the 20 and also compare the 2 min, 5 min and 30 min charts. Sometimes I use all of these, sometimes I may only use two, depends on what I'm trading. Lots of people make a very good living trading this way, but it is difficult to analyze all the information that is needed for accurate analysis.

Even experienced veterans who trade this way are having a hard time making money in this political and monetary climate of uncertainty. Uncertainty is bad for the markets.

yes, trading futures is risky, very risky, you can lose a lot really fast or you can gain a lot really fast. For instance, to trade mini oil contracts, you only need $1055 to purchase a contract and for every $0.025 movement in price, you profit or lose $12.50. The mini oil contract had a trading range today of $1.75, so thats 70 ticks or $875. And I would say that range is on the low side for oil. Yesterday, mini oil had a $3.00 range, thats $1500.

There is no way to trade equities with $1055 and potentially make $875. I'm not saying I'm trying to capture the entire range, just a little here and there at areas of what look to be low risk.(high probability of price movement in one direction)
 

Madrus Rose

post 69
Veteran
wait for your set-ups Sam & use "BASSAR" or Buy @support sell @ resistance watching for earlier pivot congestion highs & lows .
And think in the reverse too...SARBASS

The SPX from that last bounce off the 200ma 1260 (also double botto pivot low) and ran anticipation of earnings season which they did last April/May last runnup to 1370 .Then played almost exactly true to pullbak from that top R 1356 on Debt & Euro fears and resumed its rise into AAPL this week of reports they knew AAPL would "over deliver" again, blow it away & make for good headlines .

Especially after Google blew #'s away the previous week which set things on the rise into R waiting 1356/60 ...and that came off that orderly pullback to 1320 1310 & that quik touch to 1295 pivot low everyone was watching for .

With AAPL due up to the plate they were free to rise things , that was the most telegraphed earnings "beat" in history , as RIMM was a short . Though AAPL was easily shorted above $400 like NFLX was on that push up past $300 ....they were just simply overbought on RSI . There was huge "size" being sold into AAPL squeeze that day up near $400 & above.

An example of support & R look at NFLX on the pullbak trying to hold that $275 lower pivot high june but weakly , at $305 was totally over bought and threat news out of Goog or AAPL was immanent.... of getting Hulu & their own content deals after their reports .

One note on NFLX was during that last pullbak on SP to 1260/200ma you could see it barely lose its 50ma & hold that $240 , which meant "game on" for traders to send it on earnings run into July...they always do this with momos' like AAPL etc ...news doesn't matter . I was waiting for it that morning when it did $305 tho .... just knew it would push past $300 one time ;o)

So again that $240 is a lower pivot after $250 if NFLX gets hammered after eps , or that $300/305 if it pops . You do the winning trades up to eps then play the bounce or short the pop..but don't get whiplashed in the middle ,let patience bring it to you & those hi low pivots where you have the advantage of high probability .

When indicators are "extreme" like NFLX hitting that $305 , if your ready & waiting , are the lowest risk trade setups but just take patience ....the RSI was totally overbought at $277 so what was it @ $305??


Alot of shorts would love to see $225 get hit which you can see are the congestion low pivots in April & strong ...theres also $235 you can see too plus those just above at $250 .

( these pivots are seen by all traders so they work 95% of the time. But trading with indicators previously mapped out & clearly in mind when in real time gives you that ultimate pro edge .)

sc
 
Last edited:

Madrus Rose

post 69
Veteran
Pivot support & R on $Silver/AGQ/SLV really good examples since all summer Au had been range bound after the correction from $50 between $33.50 & $38.50/$39 .

Au low pivot @ $33.50 goes all the way back to the top high congestion in April . And pretty much the place to wait patiently for to trade long , then the pivot high to short at $38.50 area . All this thru the last 4mos since range bound & when things get into these trading channels its golden cause pivots are so clearly defined you just believe the chart & ignore the noise .

Now at $40 and that brief touch to $41 on the recent default risk rally can see that resistance kicked right bak in again. That $41 matches a pivot congestion high in April , & i tried heavier short waiting for that there which worked beautifully . Just as waiting for those lower pivots of $33.50 to get hit too . So here's where even if one were to not play the wiggles in between & just be patient in this one sector you get 8 winning trades with high probability of success in a 4mo period , which is just fine . Patience is the key ...don't over trade .


* also when these low high pivots get hit you can trade heavier since there's highest probability the trade will work . In the meantime trade other set-ups in other sector Etf's etc that also start to meet the same criteria . Trading the wiggles daily will throw you off & drive you crazy ....let the pre charted set-ups unfold themselves . The secret with trading silver all the way thru tho , was seeing that 50Ma acting as overhead resistance then you could have traded that too.

Au was in this range all summer as mentioned but note was in a decending triangle/wedge that was making lower highs ...generally bullish formation that breaks up & out . But short also was good to 70RSI touch at $41 ...cause now it is at top Resistance near term...which has fear premium built in & traders take profits ....which when shorting is your best friend .

Silver could easily pullbak to $36.50 , we'll see but note rsi70 & the CCI in the extreme ready to roll over a bit ...means pullbak & profitking immanent . If QE3 starts up again gold goes to 1700 & beyond unless central bank wants to take gold from treasury & sell it ! But we all know that Gold isnt money , but sure is one hell of a hedge ,lol

sc
 
Last edited:

Sundance

member
Alright Sundance, it sounds like good advise for a fundamental long term investor, exactly what I am not. I am a short term technical speculator. Your advise is useless to me, however it may be good for someone who is a long term fundamental investor.

I use intraday technical analysis and make 5 to 15 trades per day. I analyze volume, trend lines, support, resistance and moving averages, particularly the 20 and also compare the 2 min, 5 min and 30 min charts. Sometimes I use all of these, sometimes I may only use two, depends on what I'm trading. Lots of people make a very good living trading this way, but it is difficult to analyze all the information that is needed for accurate analysis.

Even experienced veterans who trade this way are having a hard time making money in this political and monetary climate of uncertainty. Uncertainty is bad for the markets.

yes, trading futures is risky, very risky, you can lose a lot really fast or you can gain a lot really fast. For instance, to trade mini oil contracts, you only need $1055 to purchase a contract and for every $0.025 movement in price, you profit or lose $12.50. The mini oil contract had a trading range today of $1.75, so thats 70 ticks or $875. And I would say that range is on the low side for oil. Yesterday, mini oil had a $3.00 range, thats $1500.

There is no way to trade equities with $1055 and potentially make $875. I'm not saying I'm trying to capture the entire range, just a little here and there at areas of what look to be low risk.(high probability of price movement in one direction)

Hi Sam

Lots and lots of ways to trade the market - and I admit that even after spending most of my professional life trading stocks in some form or another - that I dont understand, agree with, or even want to understand a bunch of them

I prefer to keep it simple

At my professional peak I was the head trader for a US $3.8 billion asset management firm

The bottom line is - how much money are you making or losing in the market

I dont day trade like you - I am not that good - at least I dont think so ... I dont feel the need that I " have to " trade on a daily basis - but I am a short to medium term investor ... dependent on how the market, and of course my stock picking is doing over time

I know my stocks ... I try my best to buy them right ... and profit

Stocks and the market dont just go up ... they go up and down

The rest is gut, fear, greed, intelligence - or lack of it ... that dictates my trading - sometimes I am lucky in timing ... sometimes not

I have done very, very well

But still - its a very dangerous game - even when its great

The idea of day trading and making a profit is a good one - but its a very difficult and sharp game to play

I try to play it as conservatively as possible and reduce risk

Naturally, I wish you and everyone the very, very best

Sundance

* Just finishing reading a book called " The Prize " by Daniel Yergin - great book about the history, politics, and business of oil
 

Madrus Rose

post 69
Veteran
Out of the fertilizers POT did catch a ride off that $50 congestion low mentioned bak a while & did 24% gain touching $62 this last week . TNH really was the star in the aggie/ferts running up nicely...one had to believe in these seasonal trades & they rose with the market .

POT is a good study on that BASSAR since it held that lower support at $50 so well & now trading right back up clearly into that top resistance ($62) again...you can see alost perfectly here now ...summer is when the aggies make or break it, but the world has to eat China has to feed her hogs ;o)

dont know why charts aren't posting, so just do the link look at the perfect example here of BASSAR

http://stockcharts.com/h-sc/ui?s=POT&p=D&b=5&g=0&id=p80780849184
 
Last edited:

Madrus Rose

post 69
Veteran
To know the indexes , good to be familiar with all the sectors & the ETF's ....at least know the first 3-5 major components or top holdings within each ETF & try to keep track on there performance . Most noted leader on last MAY runnup was the XLB and it was again the fastest to bounce off this last june swoon too!

Note now the XLB traded up to that top Resistance exactly , a triple top actually right at $41 area and pulled bak ...if you see these pivots which are so clear being respected time after time the trades are MUCH easier long & short

XLB chart shows this BASSAR very well !
http://stockcharts.com/h-sc/ui?s=XLB&p=D&b=5&g=0&id=p18813041882


So here's Top Ten Holdings in the XLB & with this last runnup in Gold & Silver on the default /Euro worries (and lets face it , they will do a QE3 too ) all the miners ran up with them which XLB as you see includes . Dupont , Monsanto , FCX, NEM in the top 5 ..so learn all 5 major ETFs & their largest holdings & gives a great window on things

1.E.I. du Pont de Nemours & Company (DD): 11.10%
2.Freeport-McMoRan Copper & Gold B (FCX): 11.05%
3.The Dow Chemical Company (DOW): 9.54%
4.Monsanto Company (MON): 8.62%
5.Newmont Mining Corporation (NEM): 6.31%
6.Praxair, Inc. (PX): 4.85%
7.Air Products and Chemicals, Inc. (APD): 4.72%
8.Alcoa Inc. (AA): 4.14%
9.PPG Industries, Inc. (PPG): 3.32%
10.International Paper Co. (IP): 3.21%
 
Last edited:

Madrus Rose

post 69
Veteran
XLF Financials ...with a 15% weight, the second heaviest ETF in SPX contains the largest Bank & Financials which has been in the market's cellar (with all the huge loan , mortgage , trading overhang)

Even with that terrible report out of Goldman & the drop last tues am to $124's they were ready to come in & buy the bad news & it bounced off $125 to land up to $135 on friday but surpirse report out of Morgan later in the week helped the XLF bounce.

Chart on XLF shows that congestion low support holding at $14.50 where they were drawing the line..no matter what the news, they were stepping in here & buying this most downtrodden but 2nd heaviest ETF finally.

Not going far but XLF a good example what is that support or BAS...they had to bounce it sometime after all the news got factored in , like Goldman they chose to step in with some serious buying finally .
http://stockcharts.com/h-sc/ui?s=XLF&p=D&b=5&g=0&id=p04622332845

be much tougher now for their trading arms of these big Banks to generate the revs they used to, with all the new regulations ...think GS trading makes up 40% of total revs.

Oh , here's the most weighted Top Holdings in this 2nd largest ETF


XLF Top Ten Holdings

http://etfdb.com/etf/XLF/holdings/


  1. JPMorgan Chase & Co (JPM): 8.94%
  2. Wells Fargo & Co (WFC): 8.15%
  3. Berkshire Hathaway Inc B (BRK.B): 7.36%
  4. Citigroup Inc (C): 6.68%
  5. Bank of America Corp DE (BAC): 6.10%
  6. The Goldman Sachs Group Inc (GS): 3.78%
  7. American Express Company (AXP): 2.97%
  8. U.S. Bancorp (USB): 2.70%
  9. Metlife Inc. (MET): 2.55%
  10. Morgan Stanley (MS): 1.95%
Percentage of holdings 51.18%
 
Last edited:

Madrus Rose

post 69
Veteran

Madrus Rose

post 69
Veteran
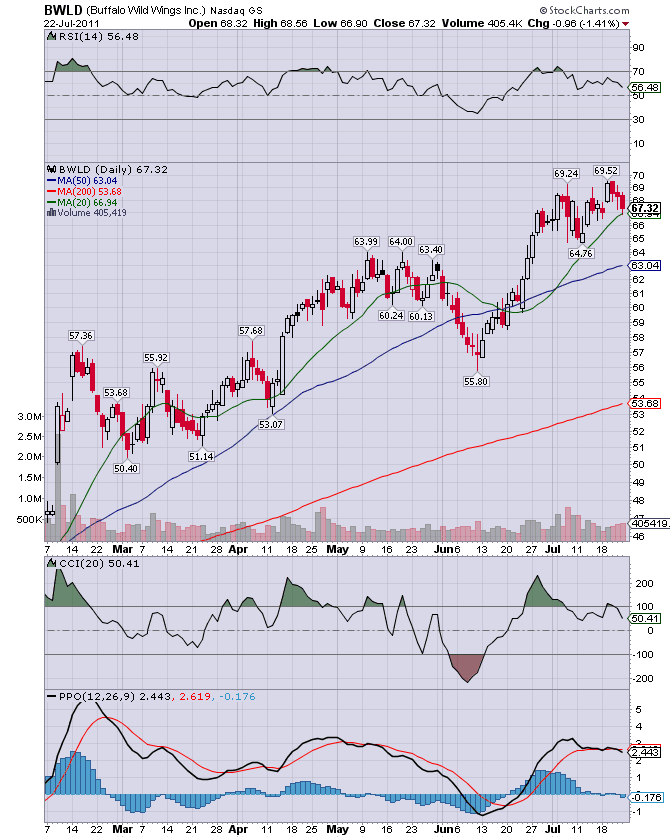
BWLD ..you guys know i told you to buy Hot Wings bak in march, lol....most all the restaurant stoks & coffees were in hot worlds of their own ....and of course the stars MCD's & SBUX . 'These are the safe haven stocks literally people have to eat ...CMG at all time highs .


BWLD a good example now of that "Top Resistance" being hit ...this is where bigger traders decide that proper valuations have been reached and sytart to take serious profits ...in case of BWLD this number was just under $70 . One could do a larger short the 2nd touch there with little risk for high reward and larger bet .

This chart is really classic of top being formed there at $70 , NOTE the decsending RSI on the 2nd touch to $69+ which almost screams "you an short me now cause i am going to pullback here " ...if for only 2pts who cares thats a good short scalp !

BWLD topping finally at $70...but good trade long from march,,,,but if you missed the long take the short trade !

What you're seeing here on BWLD is that "Top Congestion Highs" back in May which was the last earnings season highs . See how firm that $64 acted as "Top Resistance" ?Short trades could have been initiated there but BWLD is a strong stock , in a more recession proof sector so pullbacks were limited to JUST under the 20ma. Until the whole Market swooned later to its 200ma.

I. When to rebuy BWLD after market swoon??

Earnings were good but then it falls even more on that last June~Swoon on the entire market . NOW , where do you re~enter ??!! OK, look at the RSI reading above which was desending towards the OVERSOLD reading of 30. Then below the Chart there's 2 more indicators CCI & PPO (theres MacD but i prefer the CCI ).

As the RSI gets low the CCI is really indicating a bounce is immanent for often times the CCI clarifies the RSI which may be not as easy to read. Together the CCI which leads a little & the RSI make a powerful combo in determining when A GOOD REENTRY point is being tagged.

BWLD was strong before as any stock/Etf that trades above its 200&50ma is in bull mode, so note that as Market swooned to its 200ma BWLD traded to just below its 50ma...and there's where you look to reenter the trade around June10-13 as the CCI gets far into the Oversold area . This takes pratice & cajones as the Market was cranky then but you are trading BWLD not the market

BWLD starts bouncing a week before the Market bottomed for it is a strong stok & June leads up into July Q2 earnings runnups & few shorts want to be short into earnings on former strong stocks . Very often the same Traders that short stocks will switch to long , which i do all the time. You make $$$ both ways <vbg

BWLD earnings are DUE up this TUES !! .... so know the chart has already spoken here that $70 is resistance and its pulled back here on desending RSI so even if BWLD beats it will have trouble passing this pivot unless they really blow away ests....so you study the analysts expectations & be prepared to rebuy lower down . And lower down you have that former high of "$64" to act as one support level now .
(or short a pop too)
http://www.fool.com/investing/general/2011/07/22/buffalo-wild-wings-earnings-preview.aspx

" BWLD earnings review for tues
Revenue forecasts: On average, analysts predict $176.7 million in revenue this quarter. That would represent a rise of 21.3% from the year-ago quarter.
Wall Street earnings expectations: The average analyst estimate is earnings of $0.59 per share. Estimates range from $0.55 to $0.68.


BWLD.png


and on and on and on.... ;o)
 
Last edited:

bs0

Active member
wait for your set-ups Sam & use "BASSAR" or Buy @support sell @ resistance watching for earlier pivot congestion highs & lows .
And think in the reverse too...SARBASS

The SPX from that last bounce off the 200ma 1260 (also double botto pivot low) and ran anticipation of earnings season which they did last April/May last runnup to 1370 .Then played almost exactly true to pullbak from that top R 1356 on Debt & Euro fears and resumed its rise into AAPL this week of reports they knew AAPL would "over deliver" again, blow it away & make for good headlines .

Especially after Google blew #'s away the previous week which set things on the rise into R waiting 1356/60 ...and that came off that orderly pullback to 1320 1310 & that quik touch to 1295 pivot low everyone was watching for .

With AAPL due up to the plate they were free to rise things , that was the most telegraphed earnings "beat" in history , as RIMM was a short . Though AAPL was easily shorted above $400 like NFLX was on that push up past $300 ....they were just simply overbought on RSI . There was huge "size" being sold into AAPL squeeze that day up near $400 & above.

An example of support & R look at NFLX on the pullbak trying to hold that $275 lower pivot high june but weakly , at $305 was totally over bought and threat news out of Goog or AAPL was immanent.... of getting Hulu & their own content deals after their reports .

One note on NFLX was during that last pullbak on SP to 1260/200ma you could see it barely lose its 50ma & hold that $240 , which meant "game on" for traders to send it on earnings run into July...they always do this with momos' like AAPL etc ...news doesn't matter . I was waiting for it that morning when it did $305 tho .... just knew it would push past $300 one time ;o)

So again that $240 is a lower pivot after $250 if NFLX gets hammered after eps , or that $300/305 if it pops . You do the winning trades up to eps then play the bounce or short the pop..but don't get whiplashed in the middle ,let patience bring it to you & those hi low pivots where you have the advantage of high probability .

When indicators are "extreme" like NFLX hitting that $305 , if your ready & waiting , are the lowest risk trade setups but just take patience ....the RSI was totally overbought at $277 so what was it @ $305??


Alot of shorts would love to see $225 get hit which you can see are the congestion low pivots in April & strong ...theres also $235 you can see too plus those just above at $250 .

( these pivots are seen by all traders so they work 95% of the time. But trading with indicators previously mapped out & clearly in mind when in real time gives you that ultimate pro edge .)

sc

Wow I have a lot to learn. Thanks for posting.
 

Dankgravy

Active member
I'm going to try and read this whole thread.. Gotta get a basic working knowledge first though. All the terminology is way over my head
 

Madrus Rose

post 69
Veteran
Wow I have a lot to learn. Thanks for posting.

BWLD (Buffalo Wings) Earnings this Tues ...a case study

Look at BWLD post above , with earnings up this tuesday it makes a good real time study going into next week ... so i added chart from photo bucket i know will stick here on IC and more breakdown of the how to approach a potential trade looking at the past chart history to recent move here ... with link to Earnings preview from The Motley Fool . This is one i tolf the guys to buy bak in March for it always takes off on a "March Madness" Basketball run....yes they eat alot of wings during that time ;o)

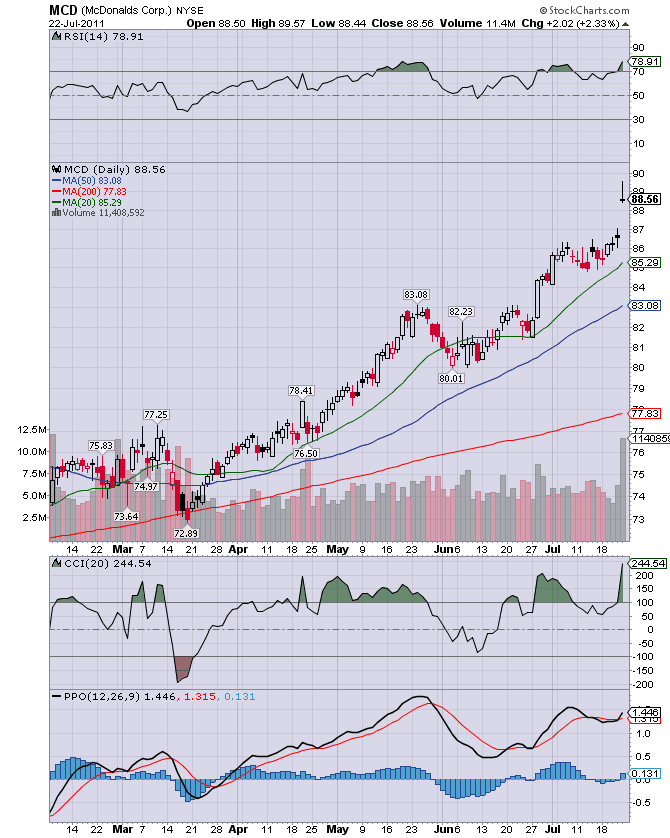
We've seen a pullback as some analysts have commented that BWLD has reached a full valuation & rate a hold here near $70 . Doesn't mean on a great report in won't pop higher tho initially . Look at McDonalds hit a new high just last week near $90 but left a tail (pulled back some) after nearly a 3pt pop .

Look at CMG or MCD charts , thru all these stormy months look at how steady these restaurant stocks have been . They're hot always in times when there's fears of recession & inflation for they will always generate earnings ...so huge $$$ have parked themselves here . Just like people will always need their Drugs, Meds & healthcare which is another sector that they parked huge $$$ is in.

Now Buffalo Wings earnings on deck and though sounds funny there's serious money here . We may smile at the Chinese pork scarcity & hog inflation where pork prices have doubled in under a year ...that this isn't technology like Apple or Google & glamorous . But food is serious business & been one of the steadiest hot sectors geneerating huge trades thru the last 6mos . People have to eat and Chinese pork is a serious staple in their diets as beef is to us . And a country's people can get very upset when Food prices get out of hand just look at the Arab revolts in Egypt where the food inflation is sky high . ( caused by food/grain traders over there doing what many of our Banks did with oil , stokpiled grains in huge wearhouses & drove prices up !!)

Note how many times MCD has been up in the shaded areas in the RSI & CCI with the lowest reading on the RSI only touching midway down to the 50 reading ...thats an incredibly strong stock[/i]

* but one thing though, if someone had been holding 200shrs of this all the way up here to "$90"... one short of a 2000shrs scalp on that pop top tail near $90 and you just netted $2,000+ for 1-2hrs of work in the am ....even if you missed the entire 6mos run up.<g

VERY often , after such a runnup an EVEN number like "90" will act as a psyhological easy mark for long traders to sell at . Look at how Apple pulled back from "$400" though analysts were giving it a $500 price target & above.


MCD.png
 
Last edited:

SpasticGramps

Don't Drone Me, Bro!
ICMag Donor
Veteran
If QE3 starts up again gold goes to 1700 & beyond unless central bank wants to take gold from treasury & sell it ! But we all know that Gold isnt money , but sure is one hell of a hedge ,lol

Good to see you. :tiphat:

Like you said QE3 is definitely getting lined up cause this ponzi needs some gas bad. Economist can't figure out why we are stuck on the launchpad on empty.

Q2 GDP data expected to show failure to launch Market Watch
WASHINGTON (MarketWatch) — Data in the coming week will be dominated by the second-quarter gross-domestic-product report on Friday which is expected to show, once again, that the economy can’t get off the ground.

Economists have been insisting for months that the economy is poised to lift off into a self-sustaining orbit, only to be forced to scrub the launch date several times.
Great analogies lol. Poor "economists" cant find their way out the paper bag.
 
Last edited:

SpasticGramps

Don't Drone Me, Bro!
ICMag Donor
Veteran
Jim Rodgers is my fucking hero. A true realist. Always concise. Never minces words. A retains a sense of humor about the central planners driving the bus off the cliff.

Jim Rogers: "The US Has Already Lost Its AAA Status...I Am Short The US Bond Market As We Speak"

While there is nothing new in the just released Jim Rogers interview with the WSJ, it is always refreshing to hear him tell the truth, which is, of course that "the US has already lost its AAA status. Who cares what Moody's say." As for the response: "The market looks ahead: this is not the first time that the market has dealt with the fact that the US is bankrupt." As for his proclivity to buy long term US debt: "I wouldn't lend money to the US in US dollars for 30 years at 3%, or 4%, or 5% or you name the interest rate.... I shorted it June 10. I am short the US bond market as we speak." Great stuff as usual.
 

SpasticGramps

Don't Drone Me, Bro!
ICMag Donor
Veteran
In light of the Greek Tragedy playing out in Washington everything is selling off early this morning except gold :D. Seeing how nothing will get passed today. It is almost certain that we will reach the Aug. 2 deadline without the debt ceiling debate resolved. On top of all this the Germans just read the fine print about the second Greek bailout and realized they were left holding the bag of shit. The German Finance Minister basically told everyone to fuck off with that plan. Expect the much heralded EU bailout resolution to fall apart in T Minus 5, 4, 3......

Wonder what Mr. Market thinks about all that?
deer%20in%20headlights.jpg


The herd appears to be spooked and have started moving in one direction. 2008 will look like a cupcake party when this is all said and done with.

Everything Not Nailed Down Getting Sold

The market has finally realized that "this" is getting real. As of the open everything, including USTs, has been sold off aggressively. Well, except for gold of course, but we all knew that. Gold just hit a new all time record above $1628. In other news, there will be a Republican press briefing at 10 am according to C-Span. Stay tuned.

ES%20quad%207.27.jpg
Let's see The Bernank with his Keynesian ascribed god like powers handle this flaming ball of shit rolling towards him. The bond vigilantes will eventually destroy him and the failed theory he represents.
 

Latest posts

Latest posts

Top