
-
Happy Birthday ICMag! Been 20 years since Gypsy Nirvana created the forum! We are celebrating with a 4/20 Giveaway and by launching a new Patreon tier called "420club". You can read more here.
-
Important notice: ICMag's T.O.U. has been updated. Please review it here. For your convenience, it is also available in the main forum menu, under 'Quick Links"!
You are using an out of date browser. It may not display this or other websites correctly.
You should upgrade or use an alternative browser.
You should upgrade or use an alternative browser.
Have you looked at the North Pole lately?
- Thread starter igrowone
- Start date
Have you clicked onto any of the links in that shit you posted ?Oh look here's ya mate Richard taking payments of oil and coal companies!!
Richard Lindzen
Richard Lindzen Credentials Background Richard S. Lindzen is former Alfred P. Sloan Professor of Meteorology at the Massachusetts Institute of Technology (MIT), a position he held from 1983 until his retirement in 2013.3“Faculty News,” EAPS, May 31, 2013. […]www.desmog.com
Another pathetic attempt!
Try this one ya dick head

"In his 1995 article, “The Heat Is On,” Ross Gelbspan reported Lindzen charged oil and coal organizations $2,500 per day for his consulting services."
So what most 'stnuc get paid for their time, not sure what your point is ?
"In response, Lindzen reported that he had received $25,000 per year for his position at the Cato Institute since 2013. He also disclosed $1,500 from the Texas Public Policy Foundation for a “climate science lecture” in 2017, and approximately $30,000 from Peabody Coal in connection to testimony Lindzen gave at a proceeding of the Minnesota Public Utilities Commissions in September 2015.17"
Here ya go, its hidden behind a pay wall thoSpeaking of links how hard is it to provide a link, arsekick?
Pasted it below for you, sort of lol
Last edited:
7. Arctic sea ice changes over the last 10,000 years
In recent years, several researchers have developed an interesting new “proxy” for Arctic sea ice cover, called “PIP-25”, which can be used for estimating long-term changes in Arctic sea ice extent. A “proxy” is a type of measurement which can be used as an indirect estimate of some property – in this case, Arctic sea ice cover.In 2007, Prof. Simon Belt and colleagues noticed that a type of algae which seems to only grow in sea ice produces a specific group of molecules called “IP-25” – see Belt et al., 2007 (link to abstract, link to Google Scholar). They found that if the sea ice in a region melts in the summer, some of this IP-25 will sink to the bottom of the ocean as part of the ocean sediment. However, if there is no sea ice, or if the sea ice remains frozen all year, then the ocean sediment for that year doesn’t contain any IP-25. They realised that if you drill an ocean sediment core for that region, you could use the presence of IP-25 as a proxy for “seasonal sea ice”, i.e., ice that only forms for part of the year.
Later, it was realised that if the IP-25 was absent you could also use the presence of certain species of phytoplankton to distinguish between periods with permanent ice cover (less phytoplankton growth because the sea ice reduces the amount of sunlight under the ice) and ice-free conditions (more phytoplankton growth). So, by combining the IP-25 and phytoplankton measurements in an ocean sediment core, you have a “PIP-25” proxy series (“P” for phytoplankton) which can distinguish between three types of sea ice cover:
- Permanent ice cover (low IP-25 and low phytoplankton)
- Seasonal ice cover (high IP-25)
- Mostly ice-free (low IP-25, but high phytoplankton)
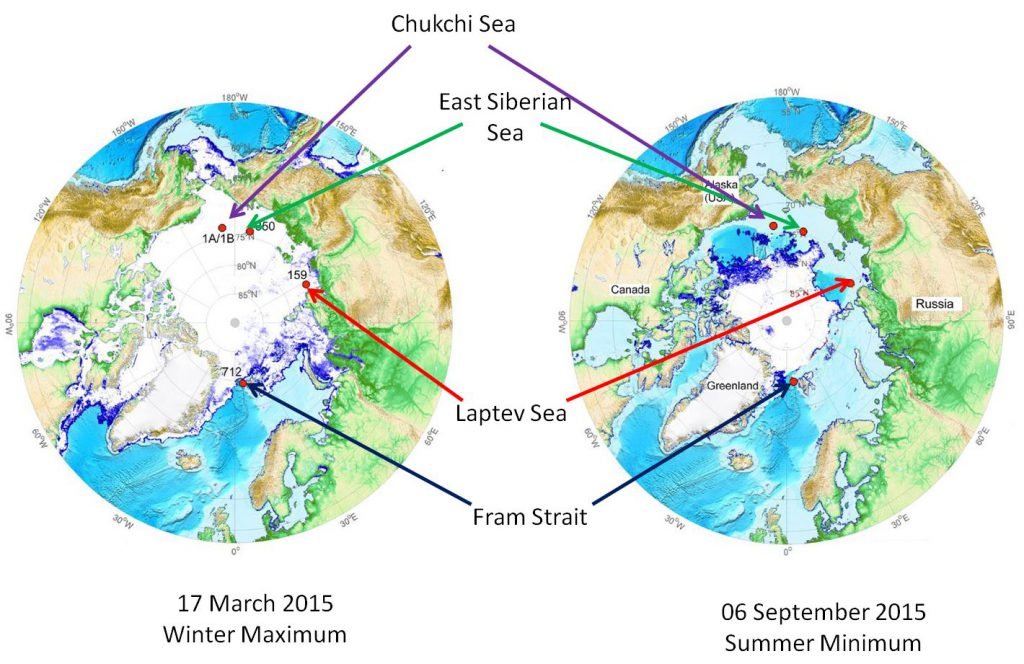
We have adapted the maps below from Figure 2 of Stein et al., 2017, with some editing to make the locations easier to see. The maps show the location of the four cores relative to the maximum and minimum Arctic sea ice extents in 2015. The four cores are quite well distributed throughout the Arctic and so should give us a reasonable estimate of how sea ice has varied throughout the Arctic over longer time scales.
Notice that all four locations were ice-free during the summer minimum (06 September 2015), but three of the locations (the Chukchi Sea, East Siberian Sea and Laptev Sea cores) were ice-covered during the winter maximum. In other words, these three locations currently experience “seasonal sea ice cover”. The remaining location (the Fram Strait core) was still outside the ice extent even during the winter maximum (17 March 2015). So, currently that location is “mostly ice-free”. However, as we will see, the PIP-25 sediment cores suggest that these conditions have changed over time.
For the four plots below, we have digitized the PIP-25 results for the four sediment cores from Figure 10 of Stein et al., 2017. Roughly speaking, PIP-25 values below about 0.5 indicate that the region was mostly ice-free at the time (Stein et al., 2017 use the term “reduced sea-ice cover”), while values above about 0.7 indicate that the region was permanently ice-covered, i.e., it remained ice-covered throughout the entire year (Stein et al., 2017 use the term “perennial sea-ice cover”). Values between 0.5 and 0.7 indicate that the region experienced “seasonal ice coverage”, i.e., it was usually ice-covered during the winter maximum, but ice-free during the summer minimum.
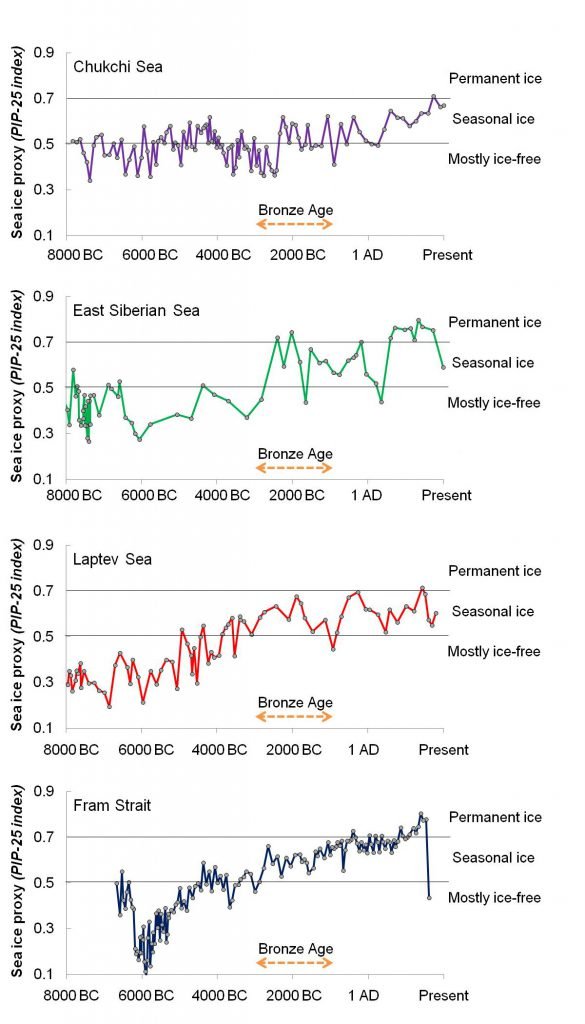
Figure 9. The PIP-25 proxy reconstructions of sea ice coverage of the last 10,000 years for the four locations described above. Data digitized from Stein et al. (2017).
As we discussed above, three of the locations (the Chukchi Sea, East Siberian Sea and Laptev Sea sites) currently experience “seasonal ice coverage” and the Fram Strait site is currently “mostly ice-free”. However, according to the PIP-25 data, over the last 10,000 years, all four of these sites have gone through extensive periods with less ice coverage as well as extensive periods with more ice coverage. In particular, all four locations seem to have experienced much less ice coverage 6,000-8,000 years ago (i.e., well before the Bronze Age) than they do today.
This suggests two points particularly relevant to our discussion:
1. Arctic sea ice extents have shown a lot of variability over the last 10,000 years (at least), so we shouldn’t be too surprised that the extents have substantially changed since the start of the satellite records in 1978.
2. Despite the widespread belief that the current Arctic sea ice coverage is “unusually low” (based on a combination of the 1978-present satellite records and computer model results), it seems that the coverage was actually a lot lower 6,000-8,000 years ago.
8. Summary
- While Arctic sea ice has generally declined since the start of the satellite era in 1978, Antarctic sea ice has generally increased over the same period.
- While there seems to have been some warming in part of Antarctica (the western peninsula) and this has received a lot of media attention, most of the continent hasn’t warmed and in many regions has actually cooled.
- After re-calibrating the pre-satellite data, it now transpires that Arctic sea ice has alternated between periods of sea ice retreat and growth. The satellite record coincidentally began at the end of one of the sea ice growth periods. This has led to people mistakenly thinking the post-1978 sea ice retreat is unusual.
- The results from new sea ice proxies taken from ocean sediment cores suggest that Arctic sea ice extent has varied substantially over the last 10,000 years. They also suggest that Arctic sea ice extent was actually less before the Bronze Age than it is today.
- The current Global Climate Models are unable to reproduce the observed Arctic sea ice changes since 1901, and they seem to dramatically underestimate the natural sea ice variability.
of course it is.Here ya go, its hidden behind a pay wall tho
You could always click on the PDF link and pay to read it.of course it is.
Or read a summery of it above


what if the stuff they spray the sky with )chemtrails( creates a temperature inversion?
Brother Nature
Well-known member
What about the fake clouds that China is making? Are they being produced to hide the Jewish space lasers?

ILoveWeed138
Member
I'm quite certain the tiny hats were not kicked out of 109 nations over 1030 times for making space lasers... lolWhat about the fake clouds that China is making? Are they being produced to hide the Jewish space lasers?
Dime
Well-known member
Trudeau blamed the fires on climate change
Porky82
Well-known member
Fuck your not all there are ya!what if the stuff they spray the sky with )chemtrails( creates a temperature inversion?


Did you click on that link from Desmog ?Fuck your not all there are ya!
Porky82
Well-known member
Nah I'm over in the political thread posting videos of some of the most stupid people alive!!Did you click on that link from Desmog ?
It takes you to the top ten squirters on Only FansNah I'm over in the political thread posting videos of some of the most stupid people alive!!
Dime
Well-known member
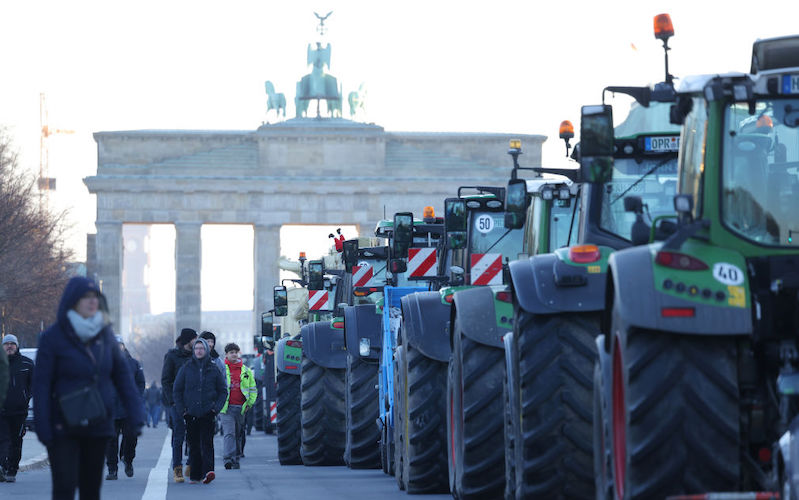
German farmer protests: Thousands of tractors, trucks block Berlin city center - LifeSite
Tens of thousands of farmers, truckers, and other workers converged on Berlin and blocked the city’s government district in protest of the left-wing German regime’s environmental policies.
 www.lifesitenews.com
climate change didn't start them, but hotter/drier weather (with wind) sure make them burn hotter & lots harder to put out.Trudeau blamed the fires on climate change
ILoveWeed138
Member
Allow me to trample on these egg shells...

 gab.com
KillYourTV on Gab: 'In 1543 Martin Luther who created Protestant Refo…'
KillYourTV on Gab: 'In 1543 Martin Luther who created Protestant Reformation wrote a book... #Noticewave #Sayanim #MartinLuther'
what about them? you tell me.What about the fake clouds that China is making? Are they being produced to hide the Jewish space lasers?
Nobel Winner Refutes Climate Change Narrative, Points Out Ignored Factor | The Epoch Times
"After pointing out that the UN IPCC has 40 models which disagree wildly with each other and which cannot replicate the PAST, John Clauser states:
The models do not take account of cloud cover.
Cloud covers between 5% and 95% of the earths surface.
There is a 104 watt difference on one square meter (between 104 and 208 watts per square meter) between one third and two thirds cloud cover.
The impact of CO2 and methane?
Half a watt per square meter."
the US & other governments around the world use geoengineering for weather control.
Defense Technical Information Center
 apps.dtic.mil
Weather as a Force Multiplier: Owning the Weather in 2025
A Bill Gates Venture Aims To Spray Dust Into The Atmosphere To Block The Sun. What Could Go Wrong?
https://www.forbes.com/sites/arielcohen/2021/01/11/bill-gates-backed-climate-solution-gains-traction-but-concerns-linger/?sh=41f30443793bhttps://www.google.com/url?sa=t&rct=j&q=&esrc=s&source=web&cd=&cad=rja&uact=8&ved=2ahUKEwi4nb-etuKDAxW6JjQIHezUDiYQFnoECCgQAQ&url=https://climateviewer.com/weather-as-force-multiplier-owning-the-weather-in-2025/&usg=AOvVaw1w4469YzGZw62fUq92IO2Y&opi=89978449
It’s Time to Engineer the Sky
Global warming is so rampant that some scientists say we should begin altering the stratosphere to block incoming sunlight, even if it jeopardizes rain and cropshttps://www.google.com/url?sa=t&rct=j&q=&esrc=s&source=web&cd=&cad=rja&uact=8&ved=2ahUKEwi4nb-etuKDAxW6JjQIHezUDiYQFnoECCgQAQ&url=https://climateviewer.com/weather-as-force-multiplier-owning-the-weather-in-2025/&usg=AOvVaw1w4469YzGZw62fUq92IO2Y&opi=89978449
you think this stuff isn't happening?


