Bubbleblower
Member
If the photosynthetic performance of different light sources is to be compared, then the presently used metrics based on the quantum system are erroneous, not coherent and therefore fail.
Also photosynthesis extends further into the infrared region than previously thought and therefore the lighting metrics should be updated accordingly.
I got nothing specifically on cannabis. At the WUR they think these things matter and the container size is my own theory which was supposed to be discussed in the other thread.
Also photosynthesis extends further into the infrared region than previously thought and therefore the lighting metrics should be updated accordingly.
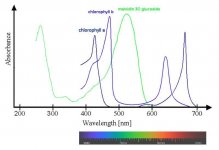
On topic is discussing Cannabis absorptance spectra, which isn't greatly affected by VPD, CO2, or container size to our knowledge (please cite published studies if we're wrong).
I got nothing specifically on cannabis. At the WUR they think these things matter and the container size is my own theory which was supposed to be discussed in the other thread.
") (We first have to do a break-in grow, though.)
(We first have to do a break-in grow, though.)