S
socioecologist
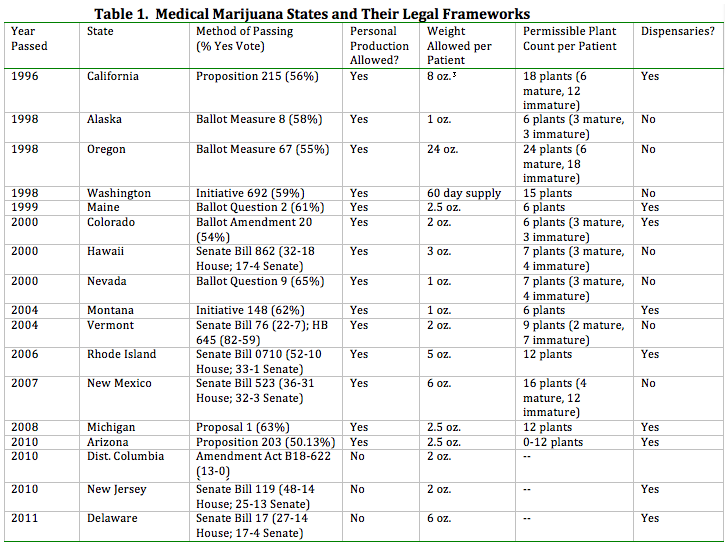
In November 1998, Oregon voters approved a ballot measure legalizing the cultivation, possession, and consumption of marijuana for qualified medical patients . Since its inception, the Oregon Medical Marijuana Program (OMMP) has experienced significant growth, starting with several hundred patients in 1998 and expanding to nearly 40,000 registered marijuana users today . The explosive development of the program has surprised many, including legislators, law enforcement officials, and the state agency tasked with overseeing it. An interesting trend has emerged under this regime of rapid growth: despite relatively homogenous health statistics for the major afflictions covered under the OMMP, Oregon counties have widely divergent rates of participation in the program.
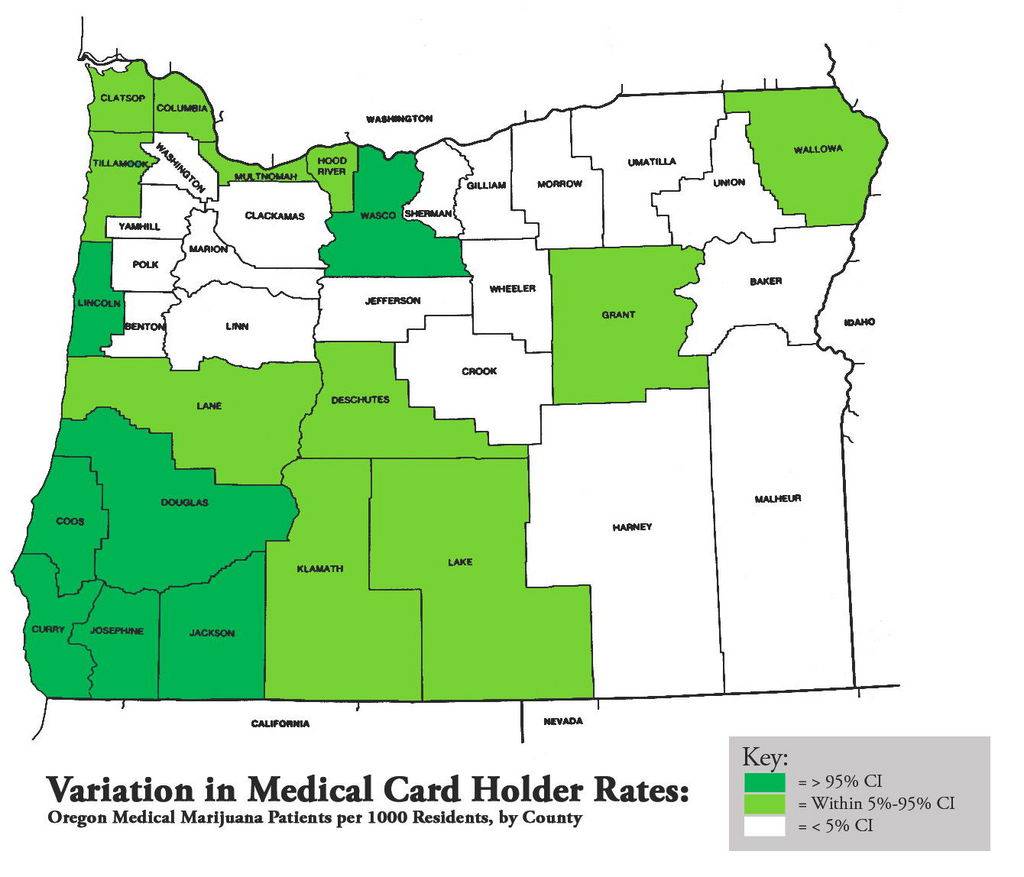
As Figure 1 illustrates, the rate of cardholders in each county (relative to population) varies significantly. Using 2011 data to construct confidence intervals on cardholder rates leads to a data-driven tripartite division; 8 counties exceed the 95% confidence interval, 10 fall within it, and 18 fall below the 5% confidence interval. This division appears relatively consistent over time; data collection at the county level began in 2005, and since that time a small cadre of counties have consistently ranked ahead of their counterparts. Several southern Oregon counties (Josephine, Curry, Coos, and Douglas) emerge as the de facto flag-bearers for medical marijuana cards, while a handful of other counties (Tillamook, Lincoln, Jackson, and Wasco) also consistently score much higher than their counterparts. Looking at the most extreme example from recent data, top-ranked Josephine county has a cardholder rate more than 9x higher than last-ranked Umatilla county (34.98 patients / 1000 residents vs. 4.84 patients /1000 residents, respectively). Rates of cardholder growth in each county are also highly variable, though all counties in Oregon have experienced rapid expansion in the last few years, with an astonishing average growth rate of 41% between 2010 and 2011.
The startling differences in cardholder rates and the lack of any existing studies on medical marijuana prevalence drives the research question for this paper: why do Oregon counties have such divergent rates of participation in the state medical marijuana program?
Figure 1.
")