What's new
  • Happy Birthday ICMag! Been 20 years since Gypsy Nirvana created the forum! We are celebrating with a 4/20 Giveaway and by launching a new Patreon tier called "420club". You can read more here.
  • Important notice: ICMag's T.O.U. has been updated. Please review it here. For your convenience, it is also available in the main forum menu, under 'Quick Links"!

Have you looked at the North Pole lately?

Porky82

Well-known member
Happy Hibernal Solstice skeptics.
here is a link to temperatures of the great north today, just days after the "melt" on Dec. 17.
not much melting going on.

WoW, -71*F in the interior, Santa better put some antifreeze in the eggnog!

Hope your Holidays are full of cheer.
global-warming-hoax-cold-56a754b03df78cf77294b089.jpg
 

Porky82

Well-known member

Ep102 Solar Variability: Flares, Coronal Mass Ejections / Cosmic Rays -The Randall Carlson Podcast​


if you are at all curious about solar modulation of climate I would encourage you to pay attention to what is discussed in the above video. as certain as the sun rises, flares and CMEs and cosmic rays effect cloud cover and temperature.
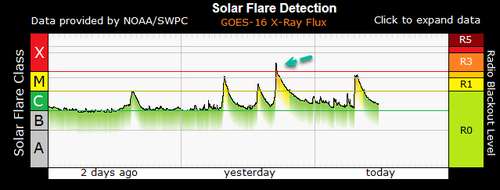
as an example, there was a sundiving comet Thursday 12/14 which resulted in a X2.8 solar flare.

Earth Blasted With X-Class Flare, Sparking "Largest Solar Radio Event Ever Recorded"​

by Tyler Durden
Friday, Dec 15, 2023 - 06:20 PM

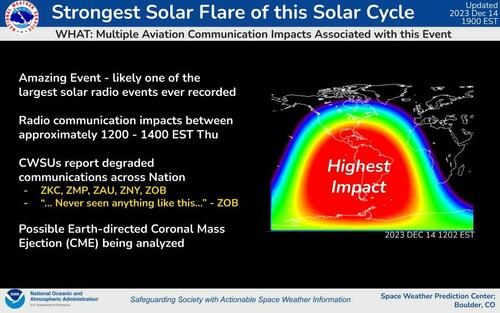
The NOAA Space Weather Prediction Center reported a massive solar flare from the northwest part of the Sun on Thursday evening that caused "one of the largest solar radio events ever recorded" across the Western Hemisphere.
"An X2.8 flare (R3) occurred from Region 3514; located over the far NW area of the Sun. This is likely one of the largest solar radio events ever recorded," SWPC wrote in a post on social media platform X.

SWPC continued, "These impacts were felt from one end of the Nation to the other. Additionally, SWPC is analyzing a possible Earth-directed Coronal Mass Ejection (CME) associated with this flare."

This monster solar flare was classified as an X2.8.

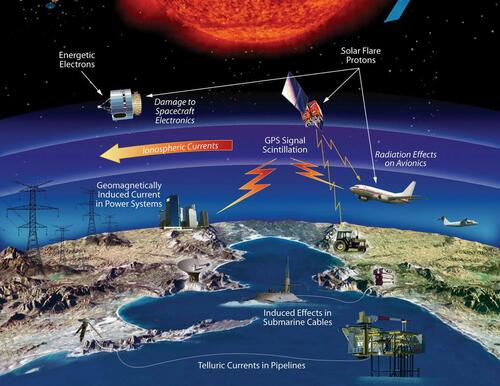
On a scale of strengths that range from B class (weakest) to C, M, and X (strongest), the powerful bursts of energy can disrupt radio communications, electric power grids, and navigation signals and pose a risk to spacecraft.
Dmqkk7fU0AACsqv_0.jpg

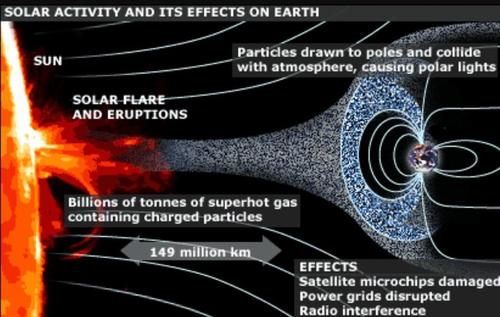
Powerful X-class solar flares can cause damage, particularly to satellites, communications systems, and power grids on Earth.

The frequency of solar flares increases as the Sun moves towards the maximum phase of Solar Cycle 25.


So you take your climate information from a far right libertarian financial blog!!
What a clown 🤡 you truly are! 🤣
The fact you are unable to produce anything of scientific credibility shows how much unable you are to even grasp the concept let alone provide anything of any credibility!
Your posts are nothing but utter garbage!!
Screenshot_20231222_082537_Chrome.jpg


LETS GO BRANDON!! 🤪
 
Last edited:

arsekick

Active member
So you don't understand what your posting then! Because that's exactly what that picture shows! Fuck your dumb! 🤣
  • 2m Temperature refers to air temperature at 2 meters above the surface. 2m Temperature Anomaly refers to the departure of the current day's forecast temperature from a long-term mean for the same day of the year. The anomalies here are calculated from a 1979–2000 climatology from the NCEP Climate Forecast System Reanalysis (CFSR). This 22-year baseline, which is used instead a 30-year 1991–2020 climate normal, represents the early part of the CFSR record prior to significant warming observed across the Arctic since the early 2000s. Users are encouraged to learn more about reanalysis — approach, strengths, limitations, and product comparisons — from the NCAR Climate Data Guide. Additional information about reanalysis can be found at Advancing Reanalysis.
 

Chi13

Well-known member
ICMag Donor
Asekick, who cares what the temperature is on any given day. What matters are changes over time, you know climate, not daily weather. You cherry pick graphs and other shit with no links?

Such as here for example; you posted one graph of many.
 

igrowone

Well-known member
Veteran

Greenland's 2023 melt season in review​

The melt season for the Greenland Ice Sheet was third highest in the 45-year passive microwave record, at 32.9 million square kilometers (12.7 millions square miles), edged out by 2010 at 33.6 million (13 million square miles), and well behind 2012 at 47.4 million square kilometers (18.3 square miles). While slow at the beginning months of April, May, and early June, melt area increased to nearly half the area of the ice sheet by mid-June, and repeatedly reached this level of melt extent over the following four weeks. As noted in our earlier blogs, melting was particularly intense in northern Greenland and along the entire southern peninsula of the island. On August 22, 2023, melt extent reached 750,000 square kilometers (290,000 square miles) in a record-setting melt event on the satellite record for the second half of August, a result of an omega-like pattern of air circulation.
Low snow accumulation in the coastal southern and northern ends of Greenland left older firn and bare ice exposed shortly after significant melting began. This darker surface absorbed more solar energy, accentuating melt. However, total snow accumulation as of May and June was above the long-term average. As the intense melting spread across much of the ice sheet in July, runoff loss increased and eventually exceeded the average annual net mass loss of the Greenland Ice Sheet at season's end.

Reaching and almost reaching the summit​

Greenland summer air temperatures have been rising, contributing to one of the most profound changes on the ice sheet—melt occurring at its highest point, Summit Station. On eleven occasions, in five different years (all since 2008 when weather data records began from the National Oceanic and Atmospheric Administration (NOAA) Global Monitory Laboratory), air temperatures at Summit have been within 1 degree Celsius (2 degrees Fahrenheit) of the melting point. On at least six occasions, temperatures have exceeded the melting point. As we have also noted in past reports, rain has fallen at Summit in 2021 for the first time in recorded history. Prior to 2008, melting at the Summit was extremely rare, occurring just once every century or so.
1703281047322.png
igure 6. This graph shows air temperatures at Summit Station, Greenland, between June 1 and September 16 for 2012, 2019, 2021, 2022, and 2023, all years with melting or near-melting conditions at that site, and in several cases more than one event in the season. The grey line (between -5 to -25 degrees Celsius) depicts the range of temperatures for all years not shown in color between 2008 and 2023. Note the log scale for the lower portion of the graph, accentuating the warm events. The scale surrounding 0 degrees Celsius is linear. — Credit: C. Shuman and M. Schnaubelt, University of Maryland, Baltimore County; Data courtesy of the National Oceanic and Atmospheric Administration (NOAA) Global Monitoring Laboratory
 
Last edited:

arsekick

Active member
Asekick, who cares what the temperature is on any given day. What matters are changes over time, you know climate, not daily weather. You cherry pick graphs and other shit with no links?

Such as here for example; you posted one graph of many.
Climate is the daily weather over time

Blind Freddie could see that
 
Top