What's new

Have you looked at the North Pole lately?

armedoldhippy

Well-known member
Veteran
hempcrete has already been tested, and been found to be cheaper, lighter in weight, and more flexible than standard concrete. just another reason cannabis/hemp should be completely legal & fully utilized...:good:
 

Chi13

Well-known member
ICMag Donor
Climate at a Glance: U.S. Wildfires

View ImageBurning pine forest in the Western United States. Image licensed from 123RF View this page as a printable PDF:
CAAG-US-western-wildfiresDownload
Bullet-Point Summary:

  • Wildfires are far less frequent and severe than was the case throughout the first half of the 20th century.
  • Occasional upticks in current wildfire activity still result in far less land burnt than was the case throughout the 20th century.
  • Even the worst recent wildfire years burned only 1/5th to 1/2 as much land as typical wildfire years during the early 20th century.
  • Drought is the key climate factor for wildfires. As shown in Climate at a Glance: Drought, the United States in recent decades is benefiting from strikingly small amounts of drought.
Short Summary: Wildfires, especially in arid parts of the United States, have always been a natural part of the environment and likely always will. Global warming did not create wildfires. In fact, wildfires have become less frequent and less severe in recent decades.
The U.S. National Interagency Fire Center reports data on U.S. wildfires back as far as 1926. The Fire Center data show the numbers of acres burned is far less now than it was throughout the early 20th century, 100 years of global warming ago. See Figure 1, below. Current acres burned run about 1/4th to 1/5th of the record values which occurred in the 1930s. At that time, the peak wildfire burn was over 52 million acres. In the decade since 2010, the peaks have been 10 million acres or less.
[URL=https://secureservercdn.net/198.71.233.109/2n8.f2f.myftpupload.com/wp-content/uploads/2020/07/US-fires-and-acres-burned-1024x576.png]View Image[/URL]Figure 1: Total wildfire acreage burned by year in the United States, 1926 to 2019. Data from https://www.nifc.gov/fireInfo/fireInfo_stats_totalFires.html
Graph by meteorologist Anthony Watts Climate alarmists sometimes cite a very small upwards trend since 1983 to suggest that climate change has been making wildfires worse in the USA. However, that is cherry-picking a very minor trend compared to the complete picture.
I put it to you that there was a lower population, less land cleared for farming, more forests to burn, therefore more forest fires.
 

igrowone

Well-known member
Veteran
quick wiki peek at hempcrete
it's not usable for load bearing, nothing perfect I suppose
but is said to be fireproof, seems popular in France and use is growing
good insulator, much used in renovation in old stone homes
 

St. Phatty

Active member
History of Wind in Mendocino county.

https://cemendocino.ucanr.edu/files/214319.pdf

Hard to find.


I'm concerned because that is the smokey tidal wave bearing down on the Pacific Coast right now.

The fire in the Mendo forest.

It's up to some big amount in terms of acres.

https://www.fire.ca.gov/incidents/2020/8/16/august-complex-includes-doe-fire/

I have the impression it's more in the middle of the forest.


If they get another wind event ... ! ! !

seems like it will be going from 750K acres to 2 Million ish.


https://www.wunderground.com/history/daily/us/ca/santa-rosa/KSTS/date/1980-9-25

Here's a cool website, it lets you look up the wind history day by day in past Septembers & Octobers at the Santa Rosa airport.
 

igrowone

Well-known member
Veteran
the end of the melt season in sight, and some interesting facts from NSIDC

In the first week of September, sea ice extent took a sharp downward turn, exceeding the pace of decline for any previous year during that period, and placing the 2020 sea ice minimum firmly as second lowest—after 2012—in the 42-year continuous satellite record. Pulses of warm air from north-central Siberia are responsible for the late downward trend. Sea ice decline has slowed in the past few days, and the annual minimum is imminent.


A recent paper by an international group led by political geographer Mia Bennett at the University of Hong Kong discusses the potential impacts of the near-future emergence of a transpolar shipping route as sea ice retreat continues to open a very wide shipping lane along the Eurasian side of the Arctic Ocean (as it has this year). The route would pass over the North Pole as a way of avoiding an extensive Russian exclusive economic zone (EEZ) and still-contended continental shelf claim.
This emerging transpolar route reflects a fundamentally changed Arctic environment. Another recent paper by researchers Laura Landrum and Marika Holland at the National Center for Atmospheric Research found that the Arctic has indeed entered into a “new Arctic climate” state. This new climate is one characterized by warmer temperatures, more open water, less sea ice, more rain, and less snow. In the Arctic, weather that used to be considered extreme is becoming the norm. The summer of 2020 is clearly representative of this new Arctic.
 

Attachments

  • N_daily_extent.jpg
    N_daily_extent.jpg
    30.6 KB · Views: 20
  • N_iqr_timeseries.jpg
    N_iqr_timeseries.jpg
    52.5 KB · Views: 24

St. Phatty

Active member
Just like pikereete from the war


18%wood / hemp pulp 82%water

i look at all these fires and think,

maybe we should stop making flammable houses.


I think planning departments might stand in the way of some of this.

I can make a structure that will survive a Richter 10 earthquake and be fire resistant, but Planning won't accept it.
 

CosmicGiggle

Well-known member
Moderator
Veteran
when life hands you lemons.....

when life hands you lemons.....

Here's a little ray of sunshine for ya, maybe we can turn this situation around:

https://phys.org/news/2020-09-effective-pathway-carbon-dioxide-ethylene.html

Researchers discover effective pathway to convert carbon dioxide into ethylene

A research team from Caltech and the UCLA Samueli School of Engineering has demonstrated a promising way to efficiently convert carbon dioxide into ethylene—an important chemical used to produce plastics, solvents, cosmetics and other important products globally.......
 

trichrider

Kiss My Ring
Veteran
[FONT=Arial, Helvetica, sans-serif] Sea ice triggered the Little Ice Age, finds a new study

Takeaways

  • Sea ice can act as an agent of climate change on a variety of timescales and spatial scales—it’s not just a passive responder to change.
  • The Little Ice Age may have arisen “out of the blue,” from internal variability within the climate system, rather than in response to an external push from volcanic eruptions or other factors.
  • A far-flung pulse of sea ice may have contributed to the demise of the Norse colonies in Greenland in the 14th and 15th centuries.
A new study finds a trigger for the Little Ice Age that cooled Europe from the 1300s through mid-1800s, and supports surprising model results suggesting that under the right conditions sudden climate changes can occur spontaneously, without external forcing.


The study, published in Science Advances, reports a comprehensive reconstruction of sea ice transported from the Arctic Ocean through the Fram Strait, by Greenland, and into the North Atlantic Ocean over the last 1400 years. The reconstruction suggests that the Little Ice Age—which was not a true ice age but a regional cooling centered on Europe—was triggered by an exceptionally large outflow of sea ice from the Arctic Ocean into the North Atlantic in the 1300s.


While previous experiments using numerical climate models showed that increased sea ice was necessary to explain long-lasting climate anomalies like the Little Ice Age, physical evidence was missing. This study digs into the geological record for confirmation of model results.


Researchers pulled together records from marine sediment cores drilled from the ocean floor from the Arctic Ocean to the North Atlantic to get a detailed look at sea ice throughout the region over the last 1400 years.


“We decided to put together different strands of evidence to try to reconstruct spatially and temporally what the sea ice was during the past one and a half thousand years, and then just see what we found,” said Martin Miles, an INSTAAR researcher who also holds an appointment with NORCE Norwegian Research Centre and Bjerknes Centre for Climate Research in Norway.


The cores included compounds produced by algae that live in sea ice, the shells of single-celled organisms that live in different water temperatures, and debris that sea ice picks up and transports over long distances. The cores were detailed enough to detect abrupt (decadal scale) changes in sea ice and ocean conditions over time.
The records indicate an abrupt increase in Arctic sea ice exported to the North Atlantic starting around 1300, peaking in midcentury, and ending abruptly in the late 1300s.

MartinM_mapgraph_535_234.jpg


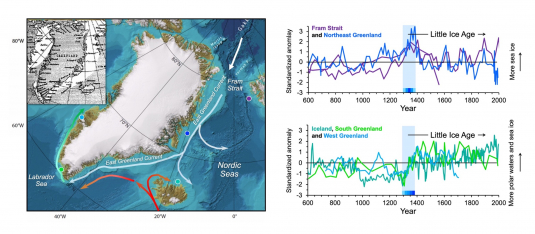
The map shows Greenland and adjacent ocean currents. Colored circles show where some of the sediment cores used in the study were obtained from the seafloor. The small historical map from the beginning of the 20th century shows the distribution of Storis, or sea ice from the Arctic Ocean, which flows down the east coast of Greenland. The graphs show the reconstructed time series of changes in the occurrence of sea ice and polar waters in the past. The colors of the curves correspond to the locations on the map. The blue shading represents the period of increased sea ice in the 1300s. The figures are modified from Miles et al., 2020.

“I've always been fascinated by not just looking at sea ice as a passive indicator of climate change, but how it interacts with or could actually lead to changes in the climate system on long timescales,” said Miles. “And the perfect example of that could be the Little Ice Age.”


“This specific investigation was inspired by an INSTAAR colleague, Giff Miller, as well as by some of the paleoclimate reconstructions of my INSTAAR colleagues Anne Jennings, John Andrews, and Astrid Ogilvie,” added Miles. Miller authored the first paper to suggest that sea ice played an essential role in sustaining the Little Ice Age.


Scientists have argued about the causes of the Little Ice Age for decades, with many suggesting that explosive volcanic eruptions must be essential for initiating the cooling period and allowing it to persist over centuries. One the hand, the new reconstruction provides robust evidence of a massive sea-ice anomaly that could have been triggered by increased explosive volcanism. On the other hand, the same evidence supports an intriguing alternate explanation.


Climate models called “control models” are run to understand how the climate system works through time without being influenced by outside forces like volcanic activity or greenhouse gas emissions. A set of recent control model experiments included results that portrayed sudden cold events that lasted several decades. The model results seemed too extreme to be realistic—so-called Ugly Duckling simulations—and researchers were concerned that they were showing problems with the models.
Miles’ study found that there may be nothing wrong with those models at all.


“We actually find that number one, we do have physical, geological evidence that these several decade-long cold sea ice excursions in the same region can, in fact do, occur,” he said. In the case of the Little Ice Age, “what we reconstructed in space and time was strikingly similar to the development in an Ugly Duckling model simulation, in which a spontaneous cold event lasted about a century. It involved unusual winds, sea ice export, and a lot more ice east of Greenland, just as we found in here.” The provocative results show that external forcing from volcanoes or other causes may not be necessary for large swings in climate to occur. Miles continued, “These results strongly suggest...that these things can occur out of the blue due to internal variability in the climate system.”


The marine cores also show a sustained, far-flung pulse of sea ice near the Norse colonies on Greenland coincident with their disappearance in the 15th century. A debate has raged over why the colonies vanished, usually agreeing only that a cooling climate pushed hard on their resilience. Miles and his colleagues would like to factor in the oceanic changes nearby: very large amounts of sea ice and cold polar waters, year after year for nearly a century.


“This massive belt of ice that comes streaming out of the Arctic—in the past and even today—goes all the way around Cape Farewell to around where these colonies were,” Miles said. He would like to look more closely into oceanic conditions along with researchers who study the social sciences in relation to climate.


Camilla S. Andresen, of the Geological Survey of Denmark and Greenland, and Christian V. Dylmer, of MMT Sweden AB, were coauthors of the study.


https://instaar.colorado.edu/news-ev...nds-new-study/
[/FONT]
 

igrowone

Well-known member
Veteran
well folks, maybe time to start roasting some chestnuts
though I guess on the west coast they're probably already roasted
but the news is the minimum has been reached
the NSIDC tells the story better than me

Arctic sea ice decline stalls out at second lowest minimum

September 21, 2020
On September 15, Arctic sea ice likely reached its annual minimum extent of 3.74 million square kilometers (1.44 million square miles). The minimum ice extent is the second lowest in the 42-year-old satellite record, reinforcing the long-term downward trend in Arctic ice extent. Sea ice extent will now begin its seasonal increase through autumn and winter. In the Antarctic, sea ice extent is now well above average and within the range of the ten largest ice extents on record, underscoring its high year-to-year variability. The annual maximum for Antarctic sea ice typically occurs in late September or early October.
 

Attachments

  • N_daily_extent.jpg
    N_daily_extent.jpg
    30.5 KB · Views: 23
  • N_iqr_timeseries.jpg
    N_iqr_timeseries.jpg
    52.6 KB · Views: 21

White Beard

Active member
Here's a little ray of sunshine for ya, maybe we can turn this situation around:

https://phys.org/news/2020-09-effective-pathway-carbon-dioxide-ethylene.html

Researchers discover effective pathway to convert carbon dioxide into ethylene

A research team from Caltech and the UCLA Samueli School of Engineering has demonstrated a promising way to efficiently convert carbon dioxide into ethylene—an important chemical used to produce plastics, solvents, cosmetics and other important products globally.......
Yeah, exactly what we need...more plastic!!! And COSMETICS!!! You know it’s crowding out the FISH, right?

Anything for a *product*, amirite?
 

trichrider

Kiss My Ring
Veteran
Near Complete Local Reduction of Arctic Stratospheric Ozone by Severe Chemical Loss in Spring 2020

I. Wohltmann
P. von der Gathen
R. Lehmann
M. Maturilli
H. Deckelmann
G. L. Manney
J. Davies
D. Tarasick
N. Jepsen
R. Kivi
N. Lyall
M. Rex

First published: 28 September 2020
https://doi.org/10.1029/2020GL089547

Abstract
In the Antarctic ozone hole, ozone mixing ratios have been decreasing to extremely low values of 0.01–0.1 ppm in nearly all spring seasons since the late 1980s, corresponding to 95–99% local chemical loss. In contrast, Arctic ozone loss has been much more limited and mixing ratios have never before fallen below 0.5 ppm. In Arctic spring 2020, however, ozonesonde measurements in the most depleted parts of the polar vortex show a highly depleted layer, with ozone loss averaged over sondes peaking at 93% at 18 km. Typical minimum mixing ratios of 0.2 ppm were observed, with individual profiles showing values as low as 0.13 ppm (96% loss). The reason for the unprecedented chemical loss was an unusually strong, long?lasting, and cold polar vortex, showing that for individual winters the effect of the slow decline of ozone?depleting substances on ozone depletion may be counteracted by low temperatures.

Plain Language Summary
The severe stratospheric chemical ozone loss in the Antarctic ozone hole and its impact on human health and climate have generated widespread public, political, and scientific interest. In contrast, Arctic stratospheric ozone reduction has been much more limited because of higher temperatures and higher transport variability in the Northern Hemisphere (lower temperatures lead to more chemical loss, and more transport can increase ozone values). In the Arctic spring 2020, however, observations of balloon sondes and satellites show that locally, absolute values of ozone (measured in mixing ratios, i.e., molecules of ozone per molecules of air) are significantly lower than in any previous year and are comparable to typical local values in the Antarctic ozone hole, albeit over a much narrower vertical layer. Locally, the chemical loss of ozone peaked at 93% in the Arctic spring of 2020, compared to values of 95–99% in the Antarctic in most winters since the late 1980s. The reason for the unprecedented loss was unusually cold and stable conditions in the Arctic stratosphere.

1 Introduction
The discovery of the Antarctic ozone hole in the 1980s (Farman et al., 1985) and of its impact on human health and climate generated widespread public, political, and scientific interest (e.g., WMO, 2018). Soon, chlorine and bromine released from decomposition of man?made chlorofluorocarbons (CFCs) and other ozone?depleting substances (ODS) in the upper atmosphere were identified as the cause of the ozone hole (Solomon et al., 1986). Chlorine is transformed from inactive reservoir gases to active chlorine species on the surfaces of polar stratospheric clouds, which only form at very low temperatures in polar winter. With the return of sunlight in spring, ozone is depleted by photochemical catalytic cycles. As a consequence of these discoveries, the production of CFCs was phased out by the Montreal protocol and chlorine levels have been slowly declining since about the year 2000 (e.g., WMO, 2018).
Ozone volume mixing ratios have been depleted from 1–3 ppm to extremely low values of 0.01–0.1 ppm in nearly all Antarctic spring seasons since the late 1980s in a wide altitude range from 360–510?K potential temperature (12–20 km; e.g., Kuttippurath et al., 2018; Solomon et al., 2014), corresponding to about 95–99% local chemical ozone loss. In recent decades, Antarctic ozone loss has reached saturation and is not expected to get any more severe (e.g., Kuttippurath et al., 2018). Early signs of a recovery due to the success of the Montreal protocol have been reported (e.g., Kuttippurath et al., 2018; WMO, 2018).
In contrast to the Antarctic, ozone depletion in the Arctic is usually much less pronounced and shows a much higher interannual variability because of the significantly higher stratospheric temperatures and higher dynamical activity in the Northern Hemisphere (e.g., Manney et al., 2011; Solomon, 1999; Solomon et al., 2014; Tegtmeier et al., 2008). In addition to less pronounced chemical depletion, ozone loss is masked by variable amounts of ozone transported in the Northern Hemisphere. On average, the variability of chemistry and transport contributes about equally to the interannual variability in Arctic polar ozone (Tegtmeier et al., 2008; Weber et al., 2011).
Ozone loss in the Arctic has ranged from almost no ozone loss in warm winters (e.g., 1998/1999 and 2018/2019) to the most severe depletion observed so far in the winter 2010/2011. Local minimum volume mixing ratios of about 0.5 ppm were observed in the winter 2010/2011 (Hommel et al., 2014; Manney et al., 2011; Solomon et al., 2014). Values reported for the ozone loss in 2010/2011 range from 2.3–2.6 ppm for the maximum loss in the vortex mean profile, corresponding to 60–80% relative loss and 84–120 DU for the column loss (e.g., Hommel et al., 2014; Kuttippurath et al., 2012; Manney et al., 2011; Pommereau et al., 2013; Sinnhuber et al., 2011; Solomon et al., 2014; Strahan et al., 2013). The wide range of values highlights the inherent uncertainty in calculating ozone loss caused by using different methods, data sets, vortex edge definitions, or altitude ranges (Griffin et al., 2019; Livesey et al., 2015). Here, we show that local ozone reduction in the winter 2019/2020 considerably exceeded the values reached in 2010/2011. Extremely low absolute values of ozone of 0.1–0.2 ppm were reached in some parts of the vortex for the first time.

https://agupubs.onlinelibrary.wiley.com/doi/10.1029/2020GL089547


Multiproxy paleoceanographic study from the western Barents Sea reveals dramatic Younger Dryas onset followed by oscillatory warming trend


  • Magdalena ??cka,
  • Danuta Michalska,
  • Joanna Paw?owska,
  • Natalia Szyma?ska,
  • Witold Szczuci?ski,
  • Matthias Forwick &
  • Marek Zaj?czkowski

Abstract
The Younger Dryas (YD) is recognized as a cool period that began and ended abruptly during a time of general warming at the end of the last glacial. New multi-proxy data from a sediment gravity core from Storfjordrenna (western Barents Sea, 253 m water depth) reveals that the onset of the YD occurred as a single short-lived dramatic environment deterioration, whereas the subsequent warming was oscillatory. The water masses in the western Barents Sea were likely strongly stratified at the onset of the YD, possibly due to runoff of meltwater combined with perennial sea-ice cover, the latter may last up to several decades without any brake-up. Consequently, anoxic conditions prevailed at the bottom of Storfjordrenna, leading to a sharp reduction of benthic biota and the appearance of vivianite microconcretions which formation is favoured by reducing conditions. While the anoxic conditions in Storfjordrenna were transient, the unfavorable conditions for benthic foraminifera lasted for c. 1300 years. We suggest that the Pre-Boreal Oscillation, just after the onset of the Holocene, may have been a continuation of the oscillatory warming trend during the YD.

Introduction
The Atlantic Meridional Overturning Circulation (AMOC) transports heat and salt northwards throughout the southern and northern Atlantic Ocean. Numerous climate predictions using numerical and theoretical models of ocean circulation suggest that the AMOC will weaken over the coming century due to glacial meltwater runoff and decreases in sea ice cover under global warming1.
One of the most striking examples of AMOC weakening from the geological past is the Bølling-Allerød (B-A)–Younger Dryas (YD; c. 12.8–11.7 ka BP) transition. The YD constituted a return to near-glacial conditions after the Earth’s climate began to shift from a cold glacial world to a warmer interglacial state at the end of the last glacial. It is generally accepted that the YD cold event resulted from a slowdown in the AMOC2. However, its consequences3 as well as its other hypothetic oceanic2, extraterrestrial4, volcanic5, and atmospheric6 causes are still debated.
Numerous marine sedimentary records attest that the northern hemisphere was subjected to rapid cooling over circa 1000 years during the YD7,8. As earlier investigations focused mainly on overviews of Late Glacial and Holocene paleoceanography of the Nordic Seas, the YD interval in marine records was presented in low temporal resolution (several hundreds of years). Although environmental variability during the YD is documented in records from the northern Atlantic Ocean9,10,11, high-resolution records from the northern part of the Nordic Seas—where the effects of ongoing global climate change are most pronounced12—remain absent.
An earlier study of sediment gravity core JM09-020-GC from Storfjordrenna (western Barents Sea; Fig. 1) revealed that the YD was not uniformly cold as had earlier been proposed and that at least some warmer periods occurred13. In this paper, we present a new multi-proxy record of the YD from core JM09-020-GC with higher temporal resolution than that presented in ??cka et al.13 consisting of sedimentological (ice-rafted debris counts), mineralogical (analyses of vivianite), micropaleontological (benthic foraminifera counts) and geochemical (Mn/Fe, oxygen stable isotopes, composition of microconcretions) analyses and we compare our results to other paleoclimatic records. Our new findings, as well as new data concerning the Arctic Ocean circulation at that time, prompted us to resume the discussion on the YD trigger and its evolution. The aim of this study is to provide a more detailed understanding of the oceanographic variability that occurred in the western Barents Sea during this stadial.

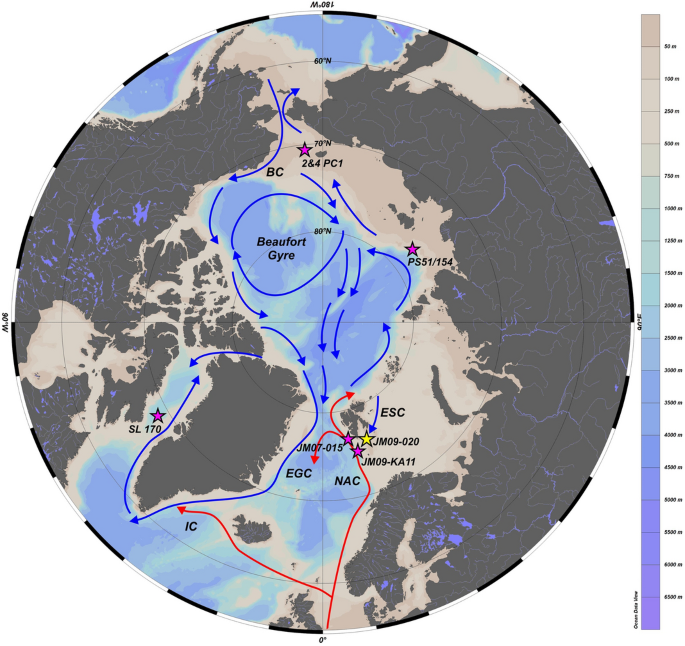
Map of the Arctic Ocean (from Ocean Data View, version ODV 5.2.1, https://odv.awi.de/14) showing present-day surface-water circulation in the North Atlantic and Arctic Oceans after Armitage et al.15 with marked locations of the core JM09-020-GC (this study; yellow star), and other cores discussed in this paper (violet stars): SL 17016, 2&4 PC117, PS51/15418, JM07-01519, JM09-KA1120,21. NAC North Atlantic Current, ESC East Spitsbergen Current, EGC East Greenland Current, IC Irminger Current, BC Bering Current.

https://www.nature.com/articles/s41598-020-72747-4

Weakening Atlantic overturning circulation causes South Atlantic salinity pile-up


  • Chenyu Zhu &
  • Zhengyu Liu
Nature Climate Change (2020)Cite this article

Abstract
The Atlantic Meridional Overturning Circulation (AMOC) is an active component of the Earth’s climate system1 and its response to global warming is of critical importance to society. Climate models have shown an AMOC slowdown under anthropogenic warming since the industrial revolution2,3,4, but this slowdown has been difficult to detect in the short observational record5,6,7,8,9,10 because of substantial interdecadal climate variability. This has led to the indirect detection of the slowdown from longer-term fingerprints11,12,13,14 such as the subpolar North Atlantic ‘warming hole’11. However, these fingerprints, which exhibit some uncertainties15, are all local indicators of AMOC slowdown around the subpolar North Atlantic. Here we show observational and modelling evidence of a remote indicator of AMOC slowdown outside the North Atlantic. Under global warming, the weakening AMOC reduces the salinity divergence and then leads to a ‘salinity pile-up’ remotely in the South Atlantic. This evidence is consistent with the AMOC slowdown under anthropogenic warming and, furthermore, suggests that this weakening has likely occurred all the way into the South Atlantic.

https://www.nature.com/articles/s41558-020-0897-7

Sea ice triggered the Little Ice Age, finds a new study


Author: Shelly Sommer and Kelsey Simpkins
Takeaways

  • Sea ice can act as an agent of climate change on a variety of timescales and spatial scales—it’s not just a passive responder to change.
  • The Little Ice Age may have arisen “out of the blue,” from internal variability within the climate system, rather than in response to an external push from volcanic eruptions or other factors.
  • A far-flung pulse of sea ice may have contributed to the demise of the Norse colonies in Greenland in the 14th and 15th centuries.


martinmiles_270_192.jpg


INSTAAR Research Associate Martin Miles in a modern subarctic fjord setting.


A new study finds a trigger for the Little Ice Age that cooled Europe from the 1300s through mid-1800s, and supports surprising model results suggesting that under the right conditions sudden climate changes can occur spontaneously, without external forcing.
The study, published in Science Advances, reports a comprehensive reconstruction of sea ice transported from the Arctic Ocean through the Fram Strait, by Greenland, and into the North Atlantic Ocean over the last 1400 years. The reconstruction suggests that the Little Ice Age—which was not a true ice age but a regional cooling centered on Europe—was triggered by an exceptionally large outflow of sea ice from the Arctic Ocean into the North Atlantic in the 1300s.
While previous experiments using numerical climate models showed that increased sea ice was necessary to explain long-lasting climate anomalies like the Little Ice Age, physical evidence was missing. This study digs into the geological record for confirmation of model results.
Researchers pulled together records from marine sediment cores drilled from the ocean floor from the Arctic Ocean to the North Atlantic to get a detailed look at sea ice throughout the region over the last 1400 years.
“We decided to put together different strands of evidence to try to reconstruct spatially and temporally what the sea ice was during the past one and a half thousand years, and then just see what we found,” said Martin Miles, an INSTAAR researcher who also holds an appointment with NORCE Norwegian Research Centre and Bjerknes Centre for Climate Research in Norway.
The cores included compounds produced by algae that live in sea ice, the shells of single-celled organisms that live in different water temperatures, and debris that sea ice picks up and transports over long distances. The cores were detailed enough to detect abrupt (decadal scale) changes in sea ice and ocean conditions over time.
The records indicate an abrupt increase in Arctic sea ice exported to the North Atlantic starting around 1300, peaking in midcentury, and ending abruptly in the late 1300s.

MartinM_mapgraph_535_234.jpg
The map shows Greenland and adjacent ocean currents. Colored circles show where some of the sediment cores used in the study were obtained from the seafloor. The small historical map from the beginning of the 20th century shows the distribution of Storis, or sea ice from the Arctic Ocean, which flows down the east coast of Greenland. The graphs show the reconstructed time series of changes in the occurrence of sea ice and polar waters in the past. The colors of the curves correspond to the locations on the map. The blue shading represents the period of increased sea ice in the 1300s. The figures are modified from Miles et al., 2020. “I've always been fascinated by not just looking at sea ice as a passive indicator of climate change, but how it interacts with or could actually lead to changes in the climate system on long timescales,” said Miles. “And the perfect example of that could be the Little Ice Age.”
“This specific investigation was inspired by an INSTAAR colleague, Giff Miller, as well as by some of the paleoclimate reconstructions of my INSTAAR colleagues Anne Jennings, John Andrews, and Astrid Ogilvie,” added Miles. Miller authored the first paper to suggest that sea ice played an essential role in sustaining the Little Ice Age.
Scientists have argued about the causes of the Little Ice Age for decades, with many suggesting that explosive volcanic eruptions must be essential for initiating the cooling period and allowing it to persist over centuries. One the hand, the new reconstruction provides robust evidence of a massive sea-ice anomaly that could have been triggered by increased explosive volcanism. On the other hand, the same evidence supports an intriguing alternate explanation.
Climate models called “control models” are run to understand how the climate system works through time without being influenced by outside forces like volcanic activity or greenhouse gas emissions. A set of recent control model experiments included results that portrayed sudden cold events that lasted several decades. The model results seemed too extreme to be realistic—so-called Ugly Duckling simulations—and researchers were concerned that they were showing problems with the models.
Miles’ study found that there may be nothing wrong with those models at all.
“We actually find that number one, we do have physical, geological evidence that these several decade-long cold sea ice excursions in the same region can, in fact do, occur,” he said. In the case of the Little Ice Age, “what we reconstructed in space and time was strikingly similar to the development in an Ugly Duckling model simulation, in which a spontaneous cold event lasted about a century. It involved unusual winds, sea ice export, and a lot more ice east of Greenland, just as we found in here.” The provocative results show that external forcing from volcanoes or other causes may not be necessary for large swings in climate to occur. Miles continued, “These results strongly suggest...that these things can occur out of the blue due to internal variability in the climate system.”
The marine cores also show a sustained, far-flung pulse of sea ice near the Norse colonies on Greenland coincident with their disappearance in the 15th century. A debate has raged over why the colonies vanished, usually agreeing only that a cooling climate pushed hard on their resilience. Miles and his colleagues would like to factor in the oceanic changes nearby: very large amounts of sea ice and cold polar waters, year after year for nearly a century.
“This massive belt of ice that comes streaming out of the Arctic—in the past and even today—goes all the way around Cape Farewell to around where these colonies were,” Miles said. He would like to look more closely into oceanic conditions along with researchers who study the social sciences in relation to climate.

https://instaar.colorado.edu/news-e...triggered-the-little-ice-age-finds-new-study/
:wave:
 

trichrider

Kiss My Ring
Veteran
Greenland is on track to lose ice faster than in any century over the last 12,000 years, study finds

Credit: Bob Wilder / University at Buffalo

Download an infographic showing simulated changes to ice in southwestern Greenland.(1.5 MB)

The research places the ice sheet’s modern decline in historical context, providing a robust look at how this century’s losses could starkly outpace prior changes

By Charlotte Hsu
Release Date: September 30, 2020

Video: Greenland's ice losses


“Basically, we’ve altered our planet so much that the rates of ice sheet melt this century are on pace to be greater than anything we’ve seen under natural variability of the ice sheet over the past 12,000 years. We’ll blow that out of the water if we don’t make severe reductions to greenhouse gas emissions. ”
Jason Briner, professor of geology
University at Buffalo

BUFFALO, N.Y. — If human societies don’t sharply curb emissions of greenhouse gases, Greenland’s rate of ice loss this century is likely to greatly outpace that of any century over the past 12,000 years, a new study concludes.
The research will be published on Sept. 30 in the journal Nature. The study employs ice sheet modeling to understand the past, present and future of the Greenland Ice Sheet. Scientists used new, detailed reconstructions of ancient climate to drive the model, and validated the model against real-world measurements of the ice sheet’s contemporary and ancient size.
The findings place the ice sheet’s modern decline in historical context, highlighting just how extreme and unusual projected losses for the 21st century could be, researchers say.

“Basically, we’ve altered our planet so much that the rates of ice sheet melt this century are on pace to be greater than anything we’ve seen under natural variability of the ice sheet over the past 12,000 years. We’ll blow that out of the water if we don’t make severe reductions to greenhouse gas emissions,” says Jason Briner, PhD, professor of geology in the University at Buffalo College of Arts and Sciences. Briner led the collaborative study, coordinating the work of scientists from multiple disciplines and institutions.

“If the world goes on a massive energy diet, in line with a scenario that the Intergovernmental Panel on Climate Change calls RCP2.6, our model predicts that the Greenland Ice Sheet’s rate of mass loss this century will be only slightly higher than anything experienced in the past 12,000 years,” Briner adds. “But, more worrisome, is that under a high-emissions RCP8.5 scenario — the one the Greenland Ice Sheet is now following — the rate of mass loss could be about four times the highest values experienced under natural climate variability over the past 12,000 years.”
He and colleagues say the results reiterate the need for countries around the world to take action now to reduce emissions, slow the decline of ice sheets, and mitigate sea level rise. The research was largely funded by the U.S. National Science Foundation.

Combining ice sheet modeling with field work, real-life observations

The study brought together climate modelers, ice core scientists, remote sensing experts and paleoclimate researchers at UB, NASA’s Jet Propulsion Laboratory (JPL), the University of Washington (UW), Columbia University’s Lamont-Doherty Earth Observatory (LDEO), the University of California, Irvine (UCI) and other institutions.
This multidisciplinary team used a state-of-the-art ice sheet model to simulate changes to the southwestern sector of the Greenland Ice Sheet, starting from the beginning of the Holocene epoch some 12,000 years ago and extending forward 80 years to 2100.

Scientists tested the model’s accuracy by comparing results of the model’s simulations to historical evidence. The modeled results matched up well with data tied to actual measurements of the ice sheet made by satellites and aerial surveys in recent decades, and with field work identifying the ice sheet’s ancient boundaries.
Though the project focused on southwestern Greenland, research shows that changes in the rates of ice loss there tend to correspond tightly with changes across the entire ice sheet.
“We relied on the same ice sheet model to simulate the past, the present and the future,” says co-author Jessica Badgeley, a PhD student in the UW Department of Earth and Space Sciences. “Thus, our comparisons of the ice sheet mass change through these time periods are internally consistent, which makes for a robust comparison between past and projected ice sheet changes.”

“We have significantly improved our understanding of how anomalous future Greenland change will be,” says co-author Joshua Cuzzone, PhD, an assistant project scientist at UCI who completed much of his work on the study as a postdoctoral researcher at JPL and UCI. “This work represents a massive success for multidisciplinary science and collaboration, and represents a framework for future successful multidisciplinary work.”
Cuzzone and other researchers at UCI and JPL led ice sheet modeling, leveraging the work of colleagues at UW, who used data from ice cores to create maps of temperatures and precipitation in the study region that were used to drive the ice sheet model simulations up to the year 1850. Previously published climate data was used to drive the simulations after that date.

UB and LDEO scientists partnered on field work that helped validate the model by identifying the ice sheet’s boundaries in southwestern Greenland thousands of years ago.
“We built an extremely detailed geologic history of how the margin of the southwestern Greenland Ice Sheet moved through time by measuring beryllium-10 in boulders that sit on moraines,” says co-author Nicolás Young, PhD, associate research professor at LDEO. “Moraines are large piles of debris that you can find on the landscape that mark the former edge of an ice sheet or glacier. A beryllium-10 measurement tells you how long that boulder and moraine have been sitting there, and therefore tells you when the ice sheet was at that exact spot and deposited that boulder.
“Amazingly, the model reproduced the geologic reconstruction really well. This gave us confidence that the ice sheet model was performing well and giving us meaningful results. You can model anything you want and your model will always spit out an answer, but we need some way to determine if the model is doing a good job.”

A continuous timeline of changes to the Greenland Ice Sheet

The study makes an important contribution by creating a timeline of the past, present and future of the Greenland Ice Sheet, Briner says. The results are sobering.
“We have long timelines of temperature change, past to present to future, that show the influence of greenhouse gases on Earth’s temperature,” Briner says. “And now, for the first time, we have a long timeline of the impacts of that temperature — in the form of Greenland Ice Sheet melt — from the past to present to future. And what it shows is eye-opening.”

“It is no secret that the Greenland Ice Sheet is in rough shape and is losing ice at an increasing rate,” Young says. “But if someone wants to poke holes in this, they could simply ask, ‘how do you know this isn’t just part of the ice sheet’s natural variability?’ Well, what our study suggests is that the rate of ice loss for this century will exceed the rate of ice loss for any single century over the last 12,000 years. I think this is the first time that the current health of the Greenland Ice Sheet has been robustly placed into a long-term context."
Despite these sobering results, one vital takeaway from the model’s future projections is that it’s still possible for people and countries around the world to make an important difference by cutting emissions, Briner says. Models of the RCP2.6 and RCP8.5 scenarios yield very different results, with high-emission scenarios producing massive declines in the ice sheet’s health, and significant sea level rise.

“Our findings are yet another wake-up call, especially for countries like the U.S.,” Briner says. “Americans use more energy per person than any other nation in the world. Our nation has produced more of the CO2 that resides in the atmosphere today than any other country. Americans need to go on an energy diet. The most affluent Americans, who have the highest energy footprint, can afford to make lifestyle changes, fly less, install solar panels and drive an energy-efficient vehicle.”
“This study shows that future ice loss is likely to be larger than anything that the ice sheet experienced in the Holocene — unless we follow a low-carbon emission scenario in the future,” Badgeley says.

The study’s authors include Jason P. Briner, Alia J. Lesnek, Elizabeth K. Thomas, Allison A. Cluett and Beata Csatho from the University at Buffalo; Joshua K. Cuzzone from the University of California, Irvine (UCI) and NASA’s Jet Propulsion Laboratory (JPL); Jessica A. Badgeley, Eric J. Steig and Gregory J. Hakim from the University of Washington; Nicolás E. Young and Joerg Schaefer from Columbia University’s Lamont Doherty Earth Observatory; Mathieu Morlighem from UCI; Nicole-Jeanne Schlegel and Eric Larour from JPL; Jesse V. Johnson and Jacob Downs from the University of Montana; Estelle Allan and Anne de Vernal from the Université du Québec à Montréal; Ole Bennike from the Geological Survey of Denmark and Greenland; and Sophie Nowicki from NASA’s Goddard Space Flight Center, who joined UB’s faculty in fall 2020.


https://www.buffalo.edu/news/releases/2020/09/044.html
 

trichrider

Kiss My Ring
Veteran
As War Danger Mounts In The Arctic, Peace Hinges On Revival Of The Wallace Doctrine


by Tyler Durden
Sun, 10/11/2020 - 20:00
Authored by Matthew Ehret via The Strategic Culture Foundation,
According to the Department of Defense’s dismally short sighted vision for the Arctic, U.S. strategic interests were best maintained not by cooperation with Arctic partners, by rather by belligerent sabre rattling under the guise of “competition” with nations who have continuously professed a desire to work with the west as allies.
Ehret-930x520%20%281%29_2.jpg

In recent weeks, this belligerence has taken the form of a new forward posture of 150 advanced U.S. fighter jets to be housed at the Eielson Airforce Base in Alaska including a mix of F22 Raptors and F35 Lighting II jets only 600 miles away from the Russia border. Each fighter plane carries the ability to launch strikes onto Russia after a brief flight across the 100 mile Bering Strait gap. Considering the entire American air force only has 187 F22s and 250 F35s, the proportions of this absurd build up can best be appreciated.
In the most recent DOD Arctic Strategy Report which has shaped this suicidal battle plan, Russia and China are defined as nothing but existential threats to the world order which must he stopped at all costs with the report’s authors stating:
In different ways, Russia and China are challenging the rules-based order in the Arctic. U.S. interests include limiting the ability of China and Russia to leverage the region as a corridor for competition that advances their strategic objectives through malign or coercive behavior.”
Describing this aggressive display that folds into the renewed threats of attack faced by dangerous NATO maneuvers across Europe in recent months, Russian Major General Vladimir Popov told Sputnik News:
Alaska is remote from the U.S. mainland, but is an outpost in relation to Russia—we are separated only by a strait, and the border is literally within the line of sight. This is a strategic region for the U.S. Adding 150 more fighters would at least double the combat potential of the existing forces there.”
Continuity of Government and NORAD

What makes this dire situation ever more precarious is the fact that President Trump has found himself stuck in a COVID-19 quarantine.
What should be a mere hiccup in governmental procedures is quickly being turned into something much greater as renewed calls for enacting Continuity of Government procedures secretively written into law this past March 2020 arising by various leading figures of the deep state such as House Speaker Nancy Pelosi. When MSNBC asked Pelosi (now second in line to take the mantle of presidency) if anyone reached out to her from the White House regarding Continuity of Government, Pelosi said: “No, they haven’t. But that is an ongoing, not with the White House but with the military, quite frankly, in terms of the — some officials in the government.”
That these calls are occurring amidst a heightened clamor for military coup to unseat the President, the general threat of civil war and the looming danger of economic meltdown, statements like those uttered by Pelosi to CNN and MSNBC this week should not be taken lightly.
In the updated March 2020 Continuity of Government protocols, General Terrance O’Shaunessy (head of both NORAD and NORTHCOM) would take the “temporary” reins of the presidency under crisis conditions of ungovernability which are not too difficult to imagine amidst the storms currently sweeping America. Military staff who would take up a parallel chain of command continue to be stationed 650 meters below Cheyenne Mountain in Colorado where they have been deployed since March 2020 following Mark Espers’ orders to NORTHCOM to “prepare to deploy”.
O’Shawnessy has repeatedly echoed the views of the Washington/NATO establishment that the greatest threats to the world stem from Russia and China directly referencing their supposedly nefarious intentions in the Arctic.
The Polar Silk Road: A Healthier Paradigm for the Arctic

Rather than bring the forces of war to the Arctic, Russia and China have together been demonstrating a far more efficient and moral approach which certain patriotic forces within North America tend to be in alignment with, including the current President.
ehret11102001.jpg

Since January 2018, the Arctic has increasingly become dominated by the positive extension of the New Silk Road northward in the form of the maritime and land based “Polar Silk Road” which has united brilliantly with President Putin’s Far East development program. This program aims to increase arctic shipping five fold by 2024 and begin a bold program of infrastructure, rail, road, pipeline, mining and port building in order to begin accessing the vital raw materials desperately needed for the coming centuries of multipolar development.
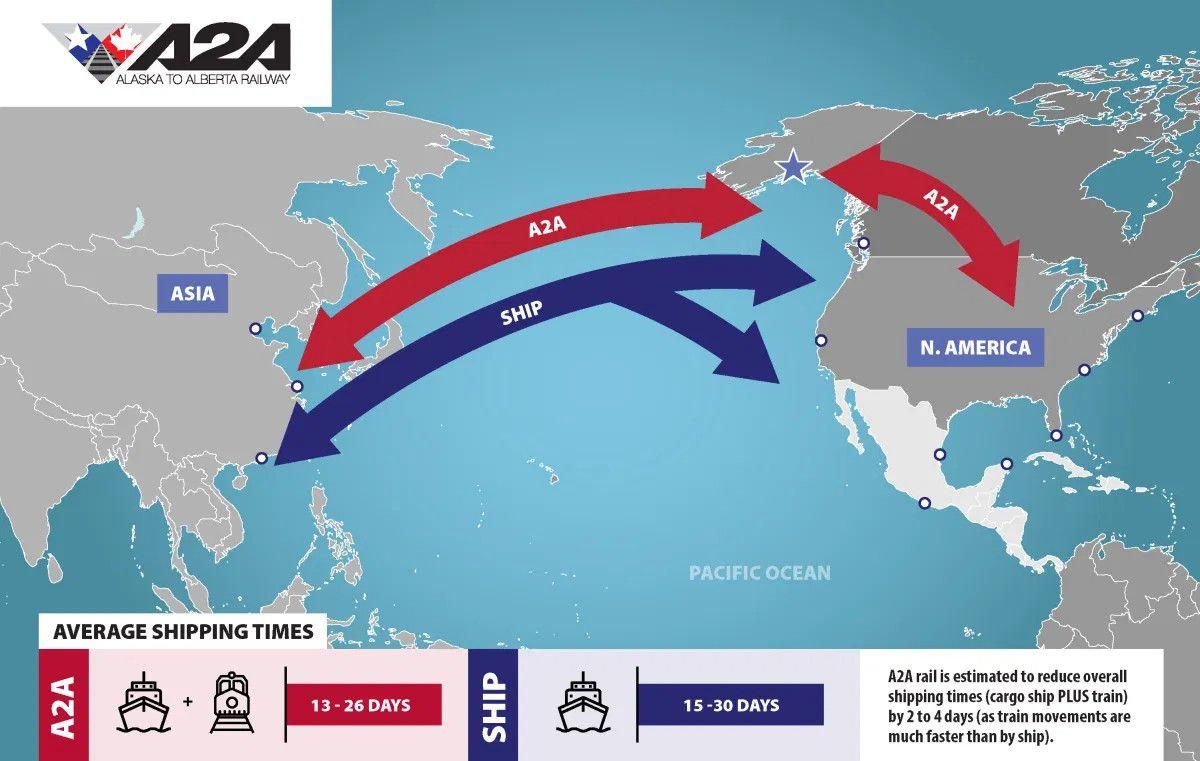
On September 26, President Trump working alongside political allies in Alaska, Alberta and the private sector alike streamlined a project which taps into this spirit of genuine economic cooperation and long term thinking unseen in decades in the form of the Alaska-Canada Rail connection. Looking at the business models guiding this emerging project, it is important to note that the destructive thinking of globalization and zero sum logic are not to be found at all as the entire program is vectored on tying North America economic interests into China’s Belt and Road and growing Asian markets.
The Wallace Doctrine for the Arctic Must Be Revived

As I wrote in my recent report Trump’s A Revival of the Wallace Doctrine for the Post-War World, the last serious pro-development strategy to arise from a leading American politician took the form of President Franklin Roosevelt’s ardent anti-imperial Vice President Henry Wallace, who spent years with his Russian counterparts during WWII arranging the conditions of mutual development of both nations during the post-War age with a strong focus on the long awaited Bering Strait Rail connection and obvious Alaska-Canada transport corridors. In his Two Peoples One Friendship, Wallace described his discussions with Foreign Minister Molotov in 1942 saying:
“Of all nations, Russia has the most powerful combination of a rapidly increasing population, great natural resources and immediate expansion in technological skills. Siberia and China will furnish the greatest frontier of tomorrow… When Molotov [Russia’s Foreign Minister] was in Washington in the spring of 1942 I spoke to him about the combined highway and airway which I hope someday will link Chicago and Moscow via Canada, Alaska and Siberia. Molotov, after observing that no one nation could do this job by itself, said that he and I would live to see the day of its accomplishment. It would mean much to the peace of the future if there could be some tangible link of this sort between the pioneer spirit of our own West and the frontier spirit of the Russian East.”
The Molotov/Wallace vision wasn’t something entirely new.
Earlier programs for building the Bering Strait rail connection were advanced by Russian Prime Minister Sergei Witte and Czar Nicholas II who in 1906 sponsored teams of American engineers to conduct feasibility studies of the project, then estimated to costs $200 million.
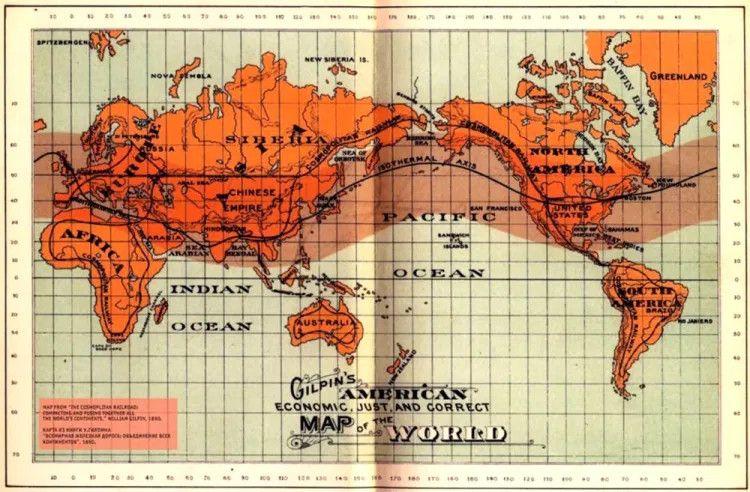
On the American side of the project, Lincoln’s trusted bodyguard William Gilpin (a man who was known as a leading spirit of America’s own Trans Continental Railway) and later Governor of Colorado promoted the work throughout his life saying of the Alaska Canada rail connection:
“It is sufficiently apparent that the building of a railroad by way of Alaska, Bering Strait and northeastern Siberia, connecting with the Canadian Pacific in British Columbia and in Siberia with the Russian line now being pushed forward to Vladivostok, is by no means an unpracticable undertaking”.
Gilpin’s global program was outlined thoroughly in his 1890 book the Cosmopolitan Railway.
ehret11102002.jpg

Exhibiting the stark raving fear of the renewal of this latent spirit of U.S.-Russian friendship in the build up to the November elections, Thomas Wright (senior Fellow at the Brookings Institute) wrote a panicky op ed in the Atlantic on September 30 called “What a Second Trump Term Would Mean for the World”. In this article, Wright echoes the broader fears of the deep state of a revival of the Henry Wallace doctrine which the author laments would have been just terrible had it not fortunately been sabotaged by the “great” figure of Harry Truman in January 1945. Wright says:
“Looking back on U.S. diplomatic history, one of the great counterfactuals is what would have happened if Franklin D. Roosevelt had not replaced his vice president Henry Wallace with Harry Truman in 1944. Wallace was sympathetic to the Soviet Union and became an ardent opponent of the Cold War. If he had become president when FDR died, in April 1945, the next half century could have gone very differently—likely no NATO, no Marshall Plan, no alliance with Japan, no overseas troop presence, and no European Union… The U.S. is now teetering on another historically important moment. With Trump, we would not only be deprived of our Truman. We would be saddled with our Wallace—a leader whose instincts and actions are diametrically opposed to what the moment requires. With few remaining constraints and a vulnerable world, a re-elected Trump could set the trajectory of world affairs for decades to come.”
It should be clear to all that the renewal of the Wallace-Gilpin spirit of development into North America’s Arctic is not only good business but also serves as a vital precondition to re-establishing a world order founded upon trust, win-win cooperation, and non-zero sum thinking. While it is fairly clear that Trump’s political instincts are vectored in this direction (giving rise to such frightful diatribes by emissaries of the Cold War at Brookings and the CFR), it still remains to be seen if sufficient political influence can be exerted to rein in the swamp before a hot war and military coup are unleashed.


Department of Defense Arctic Strategy

Reports—U.S. Government
Report to Congress: Department of Defense Arctic Strategy (Arlington, VA: Office of the Under Secretary of Defense for Policy, June 2019).
Click here to download a cached copy.
DoD’s desired end-state for the Arctic is a secure and stable region in which U.S. national security interests are safeguarded, the U.S. homeland is defended, and nations work cooperatively to address shared challenges. Protecting U.S. national security interests in the Arctic will require the Joint Force to sustain its competitive military advantages in the Indo-Pacific and Europe, identified in the NDS as key regions of strategic competition, and to maintain a credible deterrent for the Arctic region.
DoD must be able to quickly identify threats in the Arctic, respond promptly and effectively to those threats, and shape the security environment to mitigate the prospect of those threats in the future.
The 2019 DoD Arctic strategy outlines three strategic ways in support of the desired Arctic end-state:

  • Building Arctic awareness;
  • Enhancing Arctic operations; and,
  • Strengthening the rules-based order in the Arctic.
CHINA-RELATED CONTENT:
p. 4
China’s operational presence in the Arctic is more limited. It includes China’s icebreaking vessels, the Xuelong and newly-constructed Xuelong 2, and civilian research efforts, which could support a strengthened, future Chinese military presence in the Arctic Ocean, potentially including deployment of submarines to the region.
Attempts to Alter Arctic Governance through Economic Leverage: Despite having no territorial claims in the region, China is seeking a role in Arctic governance. As part of China’s “One Belt, One Road” initiative, it has linked its economic activities in the Arctic to its broader strategic objectives, as articulated in its first Arctic policy white paper in January 2018. China’s stated interests in the Arctic are primarily focused on access to natural resources and the opportunities offered by the Arctic sea routes for Chinese shipping. China does not currently have a permanent Arctic military presence, but is increasing its presence through economic outreach,
p. 5
investments in Arctic states’ strategic sectors, and scientific activities. China maintains research stations in Iceland and Norway and has pursued energy development and infrastructure projects in Russia, such as the Yamal liquefied natural gas project. China also continues to seek opportunities to invest in dual-use infrastructure in the Arctic. Despite China’s claim of being a “Near Arctic State,” the United States does not recognize any such status. …
The Arctic as a potential corridor for strategic competition: The Arctic is a potential avenue for expanded great power competition and aggression spanning between two key regions of ongoing competition identified in the NDS — the Indo-Pacific and Europe — and the U.S. homeland. U.S. interests include maintaining flexibility for global power projection, including by ensuring freedom of navigation and overflight; and limiting the ability of China and Russia to leverage the region as a corridor for competition that advances their strategic objectives through malign or coercive behavior.
p. 6
Risks to U.S. National Security Interests
Trends in the Arctic security environment present specific risks across the three sets of U.S. national security interests:
Homeland: The Arctic is strategic terrain as a potential vector for an attack on the U.S. homeland. China and Russia pose discrete and different challenges in their respective theaters, but both are also pursuing activities and capabilities in the Arctic that may present risks to the homeland. In addition to the challenge posed by strategic competitors, coastal erosion and permafrost thaw pose risks to DoD Arctic installations. Increased economic activity in the Arctic raises the probability of a mass casualty incident in the Arctic where DoD assistance may be requested. Natural disasters or other contingencies, such as an oil spill, may severely affect Alaska, requiring DoD support to civil authorities. These events may also inhibit DoD’s ability to project power from the homeland.
Shared Region: In different ways, Russia and China are challenging the rules-based order in the Arctic. Russia regulates maritime operations in the NSR, contrary to international law, and has reportedly threatened to use force against vessels that fail to abide by Russian regulations. Russia has generally followed international law and procedure in establishing the limits of its extended continental shelf. Russia could choose to unilaterally establish those limits if the procedures prove unfavorable and could utilize its military capabilities in an effort to deny access to disputed Arctic waters or resources. China is attempting to gain a role in the Arctic in ways that may undermine international rules and norms, and there is a risk that its predatory economic behavior globally may be repeated in the Arctic.
Potential Corridor for Strategic Competition: Developments in the Arctic have the potential to directly or indirectly constrain DoD’s ability to flow forces globally, and more broadly to affect U.S. strategic objectives related to competition with China and Russia in the Indo-Pacific and Europe. The Arctic remains vulnerable to “strategic spillover” from tensions, competition, or conflict arising in these other regions.
DoD Arctic Objectives
The 2018 NDS provides the overarching strategic guidance for framing DoD’s Arctic Strategy. The NDS establishes DoD’s goals and priorities for defending the homeland and protecting U.S. and allied interests globally by regaining the Joint Force’s competitive military edge against China and Russia. … … …


Report to Congress

Department of Defense Arctic Strategy


http://www.andrewerickson.com/wp-content/uploads/2019/06/DoD_Arctic-Strategy_2019.pdf


https://www.zerohedge.com/geopoliti...-arctic-peace-hinges-revival-wallace-doctrine

 
Top