
I don't get these charts..
From here don't we clearly see that methane and CO2 levels are in correlation with temperature ?
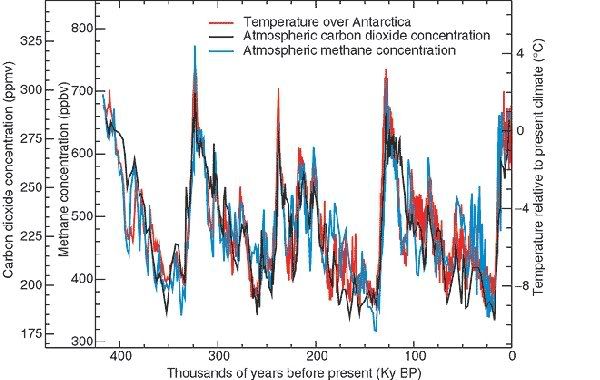
I'm sorry i don't see a cooling trend from here at all..im seeing higher lows. If anything this chart imo indicates that it's getting warmer..

Based on my trading experience..


