acespicoli
Well-known member
@pipeline 

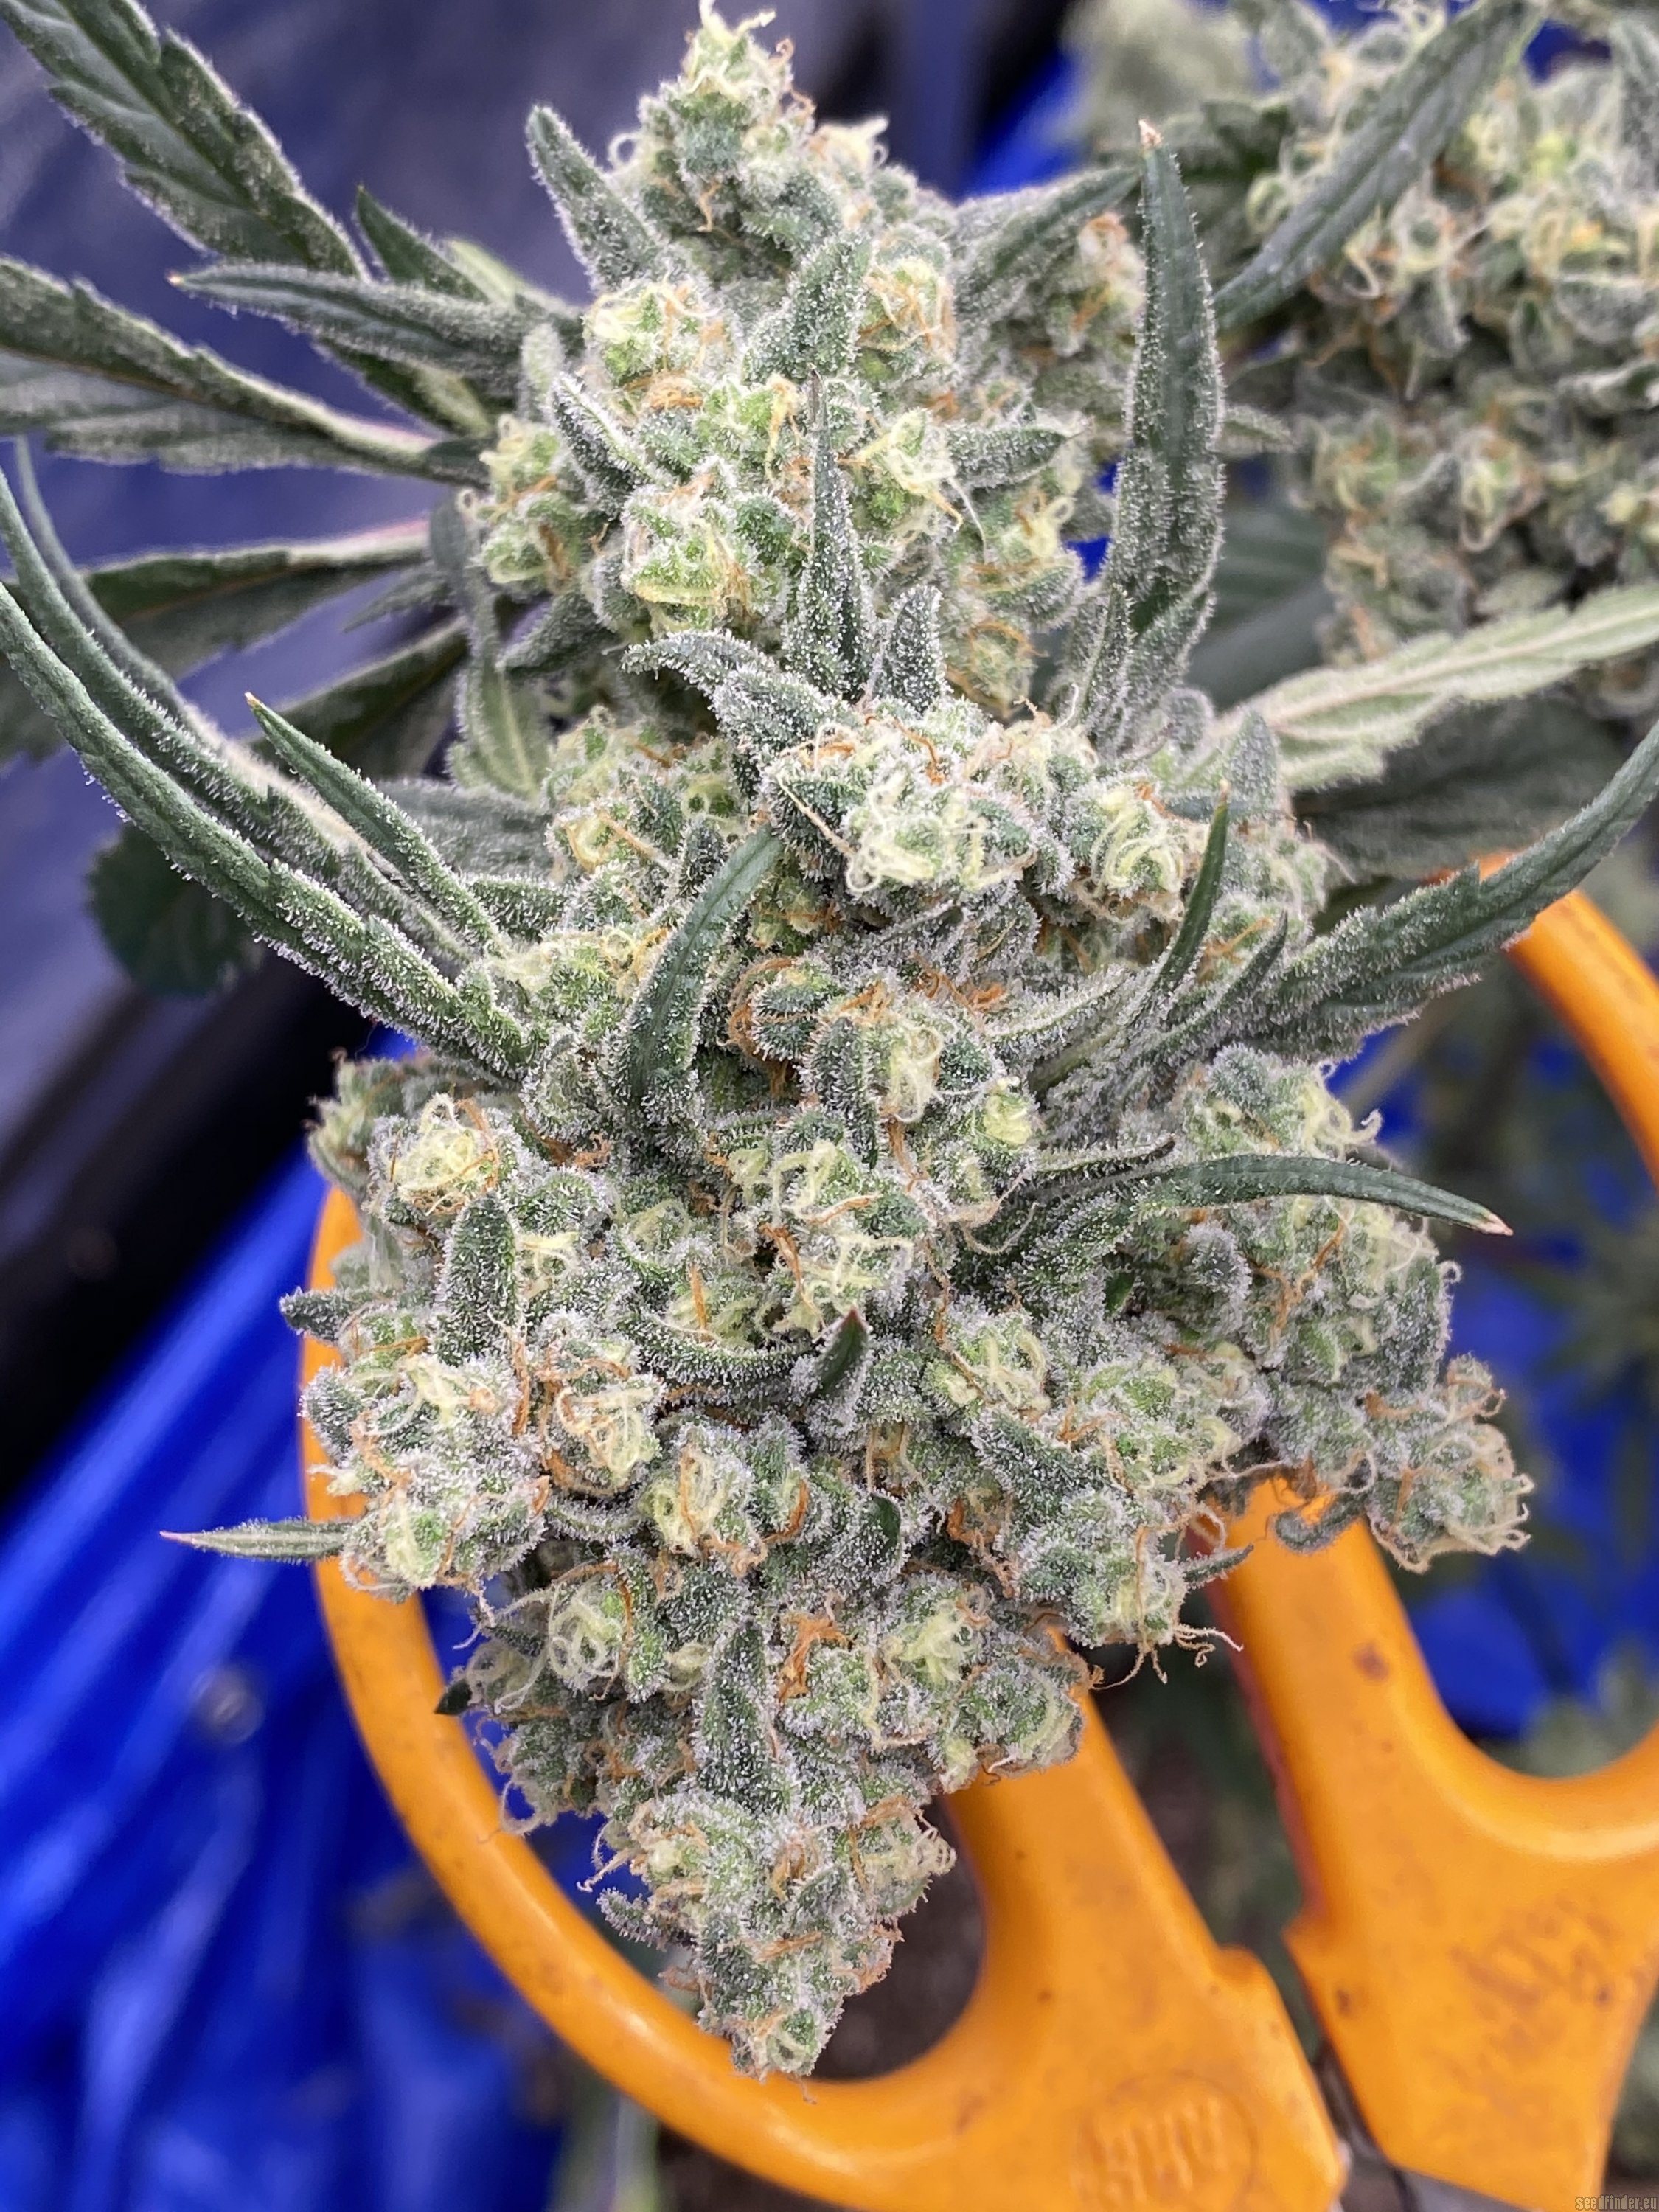
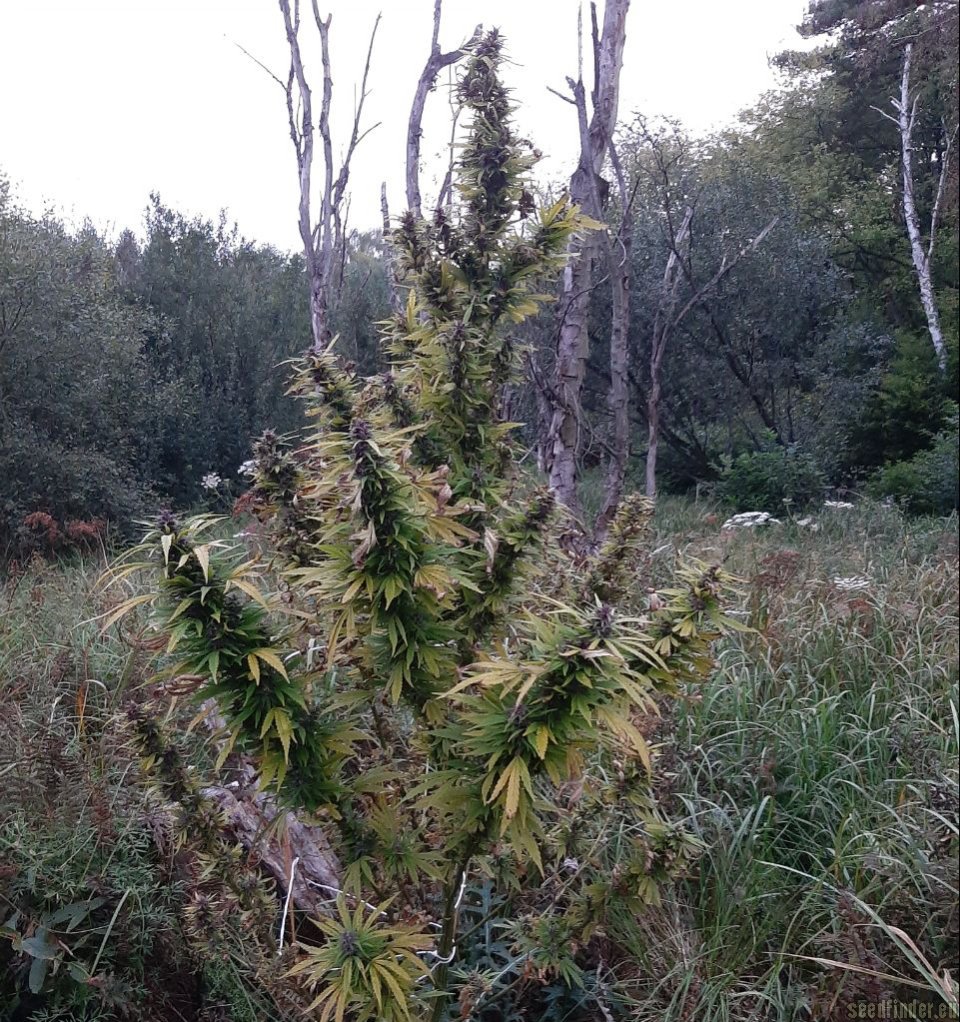
- Flo »»» Floral Line F2 x Floral Line F2 F5,6
Last edited:
Read his ic info the thread on parental plants!Cool, thank you! Does Dutch Passion offer Blueberry in regular seeds? Website says regular is out of stock, but most of their stock in other varieties is auto or fem.
Will look into Flo. Thanks for sharing that Potcast, and DJShort's screen name. I am following him now!


 www.greatlakesgenetics.com


 www.ncbi.nlm.nih.gov


Odd how with all the "knowledge" written and theories bandied about until they became facts we still don't have any actual stable "strains".


 grovebags.com

Historically and in literature sulfur is also called brimstone,[5] which means "burning stone".In Köhln, a town of monks and bones,
And pavements fang’d with murderous stones
And rags, and hags, and hideous wenches ;
I counted two and seventy stenches,
All well defined, and several stinks!
Ye Nymphs that reign o’er sewers and sinks,
The river Rhine, it is well known,
Doth wash your city of Cologne ;
But tell me, Nymphs, what power divine
Shall henceforth wash the river Rhine?


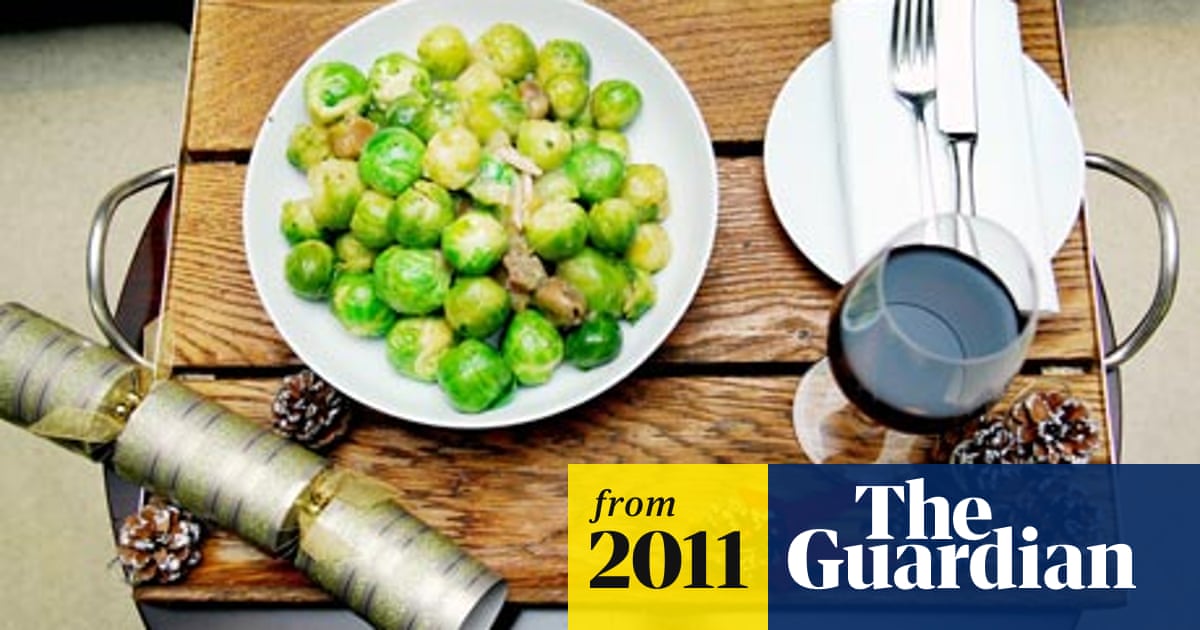
 www.theguardian.com