What's new

Breeding discussion

Status
Not open for further replies.

Grat3fulh3ad

The Voice of Reason
Veteran
muddy waters said:
good acid, Rez? :)

h3ad, interesting point... just examining more closely, Haze supposedly has specimens that flower from 18-26 weeks, that's a pretty large gap... many different colored phenos... some creeper plants, borderline perennials, some stockier christmas tree... not to mention that the famed purple individuals supposedly do NOT breed true in a straight-forward fashion, which i interpret to mean there is heterozygosity of alleles representing that trait... (correct me if i'm wrong) ... so... should we say it's true-breeding?

To me it seems that it's subjective, what "reasonably true-breeding" means... maybe we've hit on why botanists don't use that criteria for designating inbred lines, as it's open to interpretation... whereas 5 inbred gens as a rule is pretty black n white...

well, obviously true breeding is going to break down into percentages.
If the majority of the seeds from each successive 'f' generation grow plants that display the traits for which the line is bred, then how wide the swing is for the rest of the traits doesn't really factor in, imho.

Haze is certianly an excellent example of an inbred line who'se progeny, while all 'f' something, CAN'T properly be called F-anything... just like 99% of the other inbred lines out there.
 

MedResearcher

Member
Veteran
Ive heard that if a strain becomes to inbred it can become weak or have more weaknesses.

Sort of like the dogs that are super inbred, they look perfect until they start having seizures and there knees go out.
 

Grat3fulh3ad

The Voice of Reason
Veteran
MedResearcher said:
Ive heard that if a strain becomes to inbred it can become weak or have more weaknesses.

Sort of like the dogs that are super inbred, they look perfect until they start having seizures and there knees go out.
absolutely... that's one of the main advantages of hybridization.
 

GMT

The Tri Guy
Veteran
lol Im confused again. Talking about f2s, just to clarify in my mind, thats the result of self pollination on 2 succesive generations yeah? Like an F1f2 (a hybrid strain thats been selfed and selfed again) or an F3f2, (a hybrid bred to a sibling, whos off spring were breed together, whose offspring were bred together, where one of the offspring was selfed and one of its offspring selfed) accepting that and F3f2 could also be refered to as an IL yeah?
 

MedResearcher

Member
Veteran
muddy waters said:
Sounds kinda like my first run of the Deep Chunks lol

Ya, I wonder if maybe a few years ago when the DC wasnt quite as inbred if it yielded more/grew stronger. Im glad everyone is making hybrids now, too bad they didnt start 5 years ago though.

Also wonder if anyone has like 5 year old beans of DC before it had been inbred so much.

My buddy claimed, his friend's dad use to hang with Ed, and they were claming that like around 6x inbred was usually perfect anymore and it started to degrade. Just a story though, not sure how much truth there is to it, but I know they did have some of the best herb I have seen, was really infamous. :joint:
 
G

Guest

Interesting read. So general consensus say's 5 gen's and we can say the strain is now an ibl, correct? Ok, now as mentioned above inbreeding will "eventually" degrade the line. At what point, consensus wise does the line become degraded? What gen., etc? Also if line breeding for certain traits, could/would this affect when the degradation can/will occur? :joint:
 

REZDOG

Active member
Veteran
H3ad's right, and xyz is not.
It's rilly' THAT simple.
Combine that with his doerm-room like demeanor,and one can see why this thread was Doomed From the Start.
Hopefully,tpeople learned something from H3ad's posts and learned,from xYz's,how not to be a social retard.


Cheers!


.
 
G

Guest

I would like a minor point clarified.

I believe Charles Xavier quibbled a bit with H3ads's definition of "IBL". H3ad's defintion is 5+ generations and breeding relatively true...or words (all mine here paraphrasing) to the effect that variations were minimal...one would have a reasonable expection of what to expect from seeds...stability? in the resulting inbred line?

That made perfect sense to me.

Then I read CX's posts , if I am getting his words right, says IBL simply means 5+ inbred generations...stability doesn't matter.

And that also makes sense to me, BUT...what is the usefulness that definition?

What is the point of inbreeding if not to create a line which can be reproduced with a high expectation that the progeny will be reasonably uniform in the selected traits

Let's say you are at the 7th generation of an inbreeding project and the most common of 6 distinct phenos is still only 17% of the total.

H3ad would say this is NOT an example of an IBL. Enuf generations , but not enough stabilty?

CX would say it is an IBL because it has been inbred 5+ times?

Do i have this right? Is this one point of disagreement?

I'm NOT trying to stir stuff here. I am a newbie. I simply want to understand more of how you two guys H3ad and Charles Xavier think about these things.

I have difficulty following much of the discussion because I am not familiar with much of the jargon of breeding. But I can still follow a great deal of it...reaching back 40+ years to my biology classes :) So I like intelligent discussion.

XYZ may be a superb grower, and maybe even a great breeder. I can't say. However, XYZ simply doesn't provide anything useful to this conversation from my perspective.

pedro
 

Grat3fulh3ad

The Voice of Reason
Veteran
Yes, pedro, it seems you've summarized the only disagreement I have with CX quite well. And I am not really sure we disagree 100%. Surely he agrees that any seeds sold as an inbred line should be held to the more stringent standards.

I also wonder, CX, would you call the progeny of any two lines which have inbred 5 generations, true breeding or no, an F1 hybrid? I was taught that only by crossing separate distinct true breeding lines does one end up with an F1 hybrid.
 
Last edited:

Raco

secretion engineer
Moderator
ICMag Donor
Veteran
I think that many of the seeds sold as F1´s are not true F1´s..
Reason:Many of the commercial strains has Sk,NL or Haze in them.I f you cross "strain" A,which has Skunk in it(regardless of %) with "strain" B,which also contains skunk(or NL,whatever :D),then your not crossing two unrelated lines (F1)
There are many AxB crosses out there been advertised as "F1´s"
also seedbanks complaining about other seedbanks releasing F2´s derived from such "F1´s"
Too much confusion... :badday:
 
G

guest123

wow theres some reading in there ,, and some really unnessary stuff that doesnt help anyone ...
not sure why everyone has to debate silly stuff when we could all be helping one another learn ..
one thing i just cannot get through my thick head is ,,,, to obtain an inbred line ,, wouldnt one have to inbreed ????
if i have isolated the traits i desire and still have what is reffered to as an f4 , do i have an inbred line ???
i thing u guys are just splitting straws a bit ,, and it doesnt reflect well ..
arent we all on the same team ??????
or do i just wanna prove i read more than u ...... lol ...
 

Grat3fulh3ad

The Voice of Reason
Veteran
Raco said:
I think that many of the seeds sold as F1´s are not true F1´s..
Reason:Many of the commercial strains has Sk,NL or Haze in them.I f you cross "strain" A,which has Skunk in it(regardless of %) with "strain" B,which also contains skunk(or NL,whatever :D),then your not crossing two unrelated lines (F1)
There are many AxB crosses out there been advertised as "F1´s"
also seedbanks complaining about other seedbanks releasing F2´s derived from such "F1´s"
Too much confusion... :badday:
Indeed, raco... and my thing has alot more to do with the integrity of naming 'for sale' lines, than with the nit-pickiness of how one tracks their results... It bothers me none at all when an individual such as XyZ ha their own system and ideas about how things should be named. What bothers me is exactly what you talk of... absolutely no attempt at accuracy by some seedbanks... F2s sold as F1s... Polyhybrid lines sold as F1s... All that sort of thing... That is what my posts on the subject were originally directed toward... Whatever informal tracking designations individuals wish to use in their own work is their own business... Whatever people try to present as formal designations on 'for sale' beans are everyones business and should be held to as high a standard as possible.
 
Last edited:

GMT

The Tri Guy
Veteran
From my point of view I wanted to learn something new about something I love. Also my obsessive personality loves accuracy. My insecurity didn't want anyone pulling me up on anything I mislabel in my thread either. Not that I think anyone would, but ya never know. I find this stuff fascinating, and if there is a "correct" terminology out there rather than what some stoners decided everyone after them "should" call stuff who follow them, then I'd rather know it than not know it. I thought for example, not to scorn, but out of interest, that the reference Rez has admitted beginning, the IBL label, is innaccurate and all us sheep following adopted, rather than knowing that an IBL is something else and IL should be used, a real eye opener. Also as I said, the F<>f issue was entirely unknown to me. So I'm glad the thread came into being.
 

Grat3fulh3ad

The Voice of Reason
Veteran
Except that Sour Diesel IBL is actually an IBL not an IL since there were parental and sibling back crosses used in establishing his inbred/back crossed line. IBL will also be an accurate descriptor for anything I release as an inbred line as well, since I use backcrossing as well as incrossing in all of my stabilization projects.
 
Last edited:

- ezra -

.strangelove.
Veteran
wallyduck said:
wow theres some reading in there ,, and some really unnessary stuff that doesnt help anyone ...
not sure why everyone has to debate silly stuff when we could all be helping one another learn ..
one thing i just cannot get through my thick head is ,,,, to obtain an inbred line ,, wouldnt one have to inbreed ????
if i have isolated the traits i desire and still have what is reffered to as an f4 , do i have an inbred line ???
i thing u guys are just splitting straws a bit ,, and it doesnt reflect well ..
arent we all on the same team ??????
or do i just wanna prove i read more than u ...... lol ...
^^^ totally agree.

It saddens me to see such anger over semantics of nomenclature. We are all on the same team here, after all.
 

muddy waters

Active member
pedro48, per h3ad's clarification for GMT above, I think you are confusing IBL and IL. Minor thing really, but there's a reason for the different nomenclature--IBL means there was a backcross (at least one) involved.
 
G

Guest

muddy waters said:
pedro48, per h3ad's clarification for GMT above, I think you are confusing IBL and IL. Minor thing really, but there's a reason for the different nomenclature--IBL means there was a backcross (at least one) involved.

Yes you are right. I was thinking IBL was "InBredLine"
Thanks for correcting me!!!
pedro!!
 

Grat3fulh3ad

The Voice of Reason
Veteran
Here is an EXCELLENT FAQ which will shed ALOT of light on the issues raised here.

Keep in mind that it is in reference to corn. BUT, corn is a plant upon which more hybridizing and inbreeding research has been done than almost any other. AND, anyone with an open mind and a willingness to study can learn enough about genetics to serve themselves well the rest of their lives just by studying corn research and patents.

Now the FAQ... (I've highlighted portions)...


Why conserve genetic diversity?
Genetic diversity is essential for continued progress in breeding as well as for adaptation to future environmental challenges. Future environmental challenges include the need to adapt to new pest and disease strains or species, climate change, and pollutants. Maize is the most genetically diverse crop species, and is the most economically important in the U.S. We owe it to future generations to pass on the rich genetic legacy of maize and other crop species largely intact. The Panzea project will catalogue at the genomic scale the genetic diversity present both in maize and in its wild ancestor, teosinte.

What do we mean by "functional diversity"?
The majority of the diversity in the genome of a higher organism like maize is not expected to have any relationship to the fitness or even to the observable phenotypes of individuals. In other words, most DNA polymorphisms are genetically neutral. The overarching goal of the Panzea project is to identify the small minority of DNA polymorphisms in the maize genome that actually cause differences in phenotypic traits of agromomic, developmental, or evolutionary importance. It is the DNA variation at these sites that we consider to be "functional diversity".

What is teosinte?
Teosinte is the wild relative of maize. Together, teosinte and maize compose the genus Zea, which has four species: Z. luxurians, Z. diploperennis, Z. perennis, and Z. mays. Zea mays is in turn divided into four subspecies: ssp. mexicana, ssp. huehuetenangensis, ssp. parviglumis, and ssp. mays (maize). Molecular marker evidence has clearly shown that maize was domesticated from Z. mays ssp. parviglumis (Doebley 1990, Matsuoka et al. 2002).

What are maize landraces?
Maize landraces are forms of maize domesticated by the indigenous peoples of Latin and North America, and adapted to local growing conditions. The initial domestication of maize from teosinte occured about 9000 years ago in southern Mexico (Matsuoka et al. 2002). After that, cultivation of maize spread throughout the Americas, and through artificial selection, indigenous peoples developed landraces adapted to their local growing conditions and crop uses. After the arrival of Columbus, maize cultivation spread to the Old World and additional landraces were subsequently developed in Europe, Africa, and Asia.

What is the germplasm base of maize?
The maize germplasm pool includes wild teosintes, indigenous maize landraces of Latin and North America, Old World landraces and inbred lines used in modern maize breeding.

What is a SNP?
The acronym SNP stands for Single Nucleotide Polymorphism. This refers to a particular nucleotide (or "base") in a DNA sequence that is variable within a species (or between related species). For example, at a certain position in a DNA sequence there may be a C (cytosine) present in some individuals but a T (thymine) present in others. SNPs represent the most basic form of genetic polymorphism. There are tens of millions of SNPs present in the genome of a typical organism. However, usually only a very small subset of these will be developed into genetic markers (SNP markers). Although it is somewhat confusing, the term "SNP" can refer both to a particular polymorphism in the genome (for which a genetic marker may or may not have been developed) or to a marker that has been developed to evaluate (or "genotype") a particular SNP polymorphism.

Why use SNPs?
SNPs are one of many possible genetic markers. Available types of genetic markers include isozymes, RFLPs, RAPDs, CAPS, PCR-indels, AFLPs, microsatellites (SSRs), SNPs and DNA sequence. Each type of marker has its advantages and disadvantages. The main advantages of SNPs are: (1) they are so common and evenly-distributed in the genome, and (2) methods of detecting (or "assaying") SNPs can be easily automated. This ease of automation is what makes SNPs "high-throughput" markers. High-throughput means that large numbers of markers can be quickly assayed in a large number of DNA samples for a small cost per assay. This property is essential in the current genomics age. The main disadvantage of SNPs is the small number of alleles typically present. Although, in theory, each SNP marker can have up to four possible alleles (A, C, G, and T), in practice, only two alleles usually are present at any given SNP (e.g., C or T). This is a consequence of the low rate of mutation or base substitution (an analogy is that lightning rarely strikes the same person twice). Microsatellites, in contrast, typically have numerous alleles (from 5 to 40 in maize Liu et al. 2003). However, the large number of available SNPs and their low assay costs (in large scale experiments) overcome the disadvantage of their low variability per marker.

Random vs. candidate genes?
The distinction between "random" and "candidate" genes is of great importance to our project. By random genes we refer to genes which we have chosen to study without any prior knowledge or consideration of the function of the proteins (or RNAs) that they encode. These were selected from a random set of expressed DNA sequences (DNA sequences that are copied, or transcribed, into RNA), so the only thing that we knew for certain at the time of choosing was that the sequences in fact came from genes (as opposed to intergenic sequences). By candidate genes we refer to genes of known or suspected function that are likely to be involved in the control of agronomic or evolutionary traits of interest. Traits of interest to our project include flowering time, inflorescence architecture, cob development, kernel quality, leaf development, plant architecture, and traits that differ markedly between domesticated maize and its wild progenitor species, teosinte. Candidate genes are like "hunches" or educated guesses that we follow up on with additional "detective work" (experimental verification via association mapping). Random genes provide controls for these experiments since they have a very little chance of affecting particular traits of interest. In addition, random genes also provide us (by definition) with a random sample of genes from the across genome that we can use in QTL mapping studies or to answer questions such as "What proportion of genes in the genome were subjected to artificial selection during the domestication of maize?" (Wright et al. 2005).

How can our results be used to develop markers?
In the SNP discovery phase of the Panzea project, sequence alignments have already been produced for more than 3000 random genes and will be produced for roughly 1000 candidate genes. All of these sequence alignments will become available via Panzea in a variety of formats (try a molecular diversity search using marker type 'Sequencing'). The PCR primers of the amplicons corresponding to these sequence alignments are provided -- so reseachers could amplify and sequence additional plants if they wish. Researchers also can utilize our alignments to develop their own SNP, indel, or CAPS markers, or they can download the 'context sequences' for the SNP markers that we have developed and validated. The context sequences were derived from the consensus sequence of our sequence alignments, and show the sequence surrounding the SNP in question, with the target SNP in square brackets and other flanking polymorphisms in curly brackets. Currently, context sequences for 73 SNP in 15 candidate genes and for 912 SNP in 585 randomly selected genes can be downloaded from our datasets page. PCR primer sequences for the SSRs (microsatellites) that we use in our project are also available via the molecular diversity search page, using marker type 'SSR'.

What is an inbred line?
Maize and teosinte - like humans - are naturally outcrossing organisms, which means that matings that are not under direct human control usually occur between two unrelated or distantly related parents. This results in offspring in which the two copies of a gene (one from the maternal parent and one from the paternal, or pollen parent) are often different. Such offspring, containing two different alleles at a gene or locus, are said to be "heterozygous" at that gene. Breeders, farmers and researchers value uniformity and predictability. Hence, a commonly used breeding tactic in crop species is the development of inbred lines followed by crossing between certain inbred lines to produce superior seed for planting. The inbred lines are produced by repeated generations of selfing (achieved through controlled pollination) with each subsequent generation descending from a single seed. Over generations, alleles are lost by chance at those loci that were initially heterozygous, with a 50% chance of loss of an allele each generation. Hence, the resulting inbred lines tend to have the same two alleles present at virtually every gene in the genome. In other words, inbred lines are highly "homozygous" and will almost always pass on the same allele to all of their offspring. Crossing of two inbred lines together leads to "hybrid" offspring that are uniformly heterozygous at every gene that differs between the two inbred parental lines. Breeders look for combinations of inbred lines whose offspring display "hybrid vigor" or "heterosis": superior characteristics due to serendipitous combinations of alleles at the heterozygous loci.

What is QTL mapping?
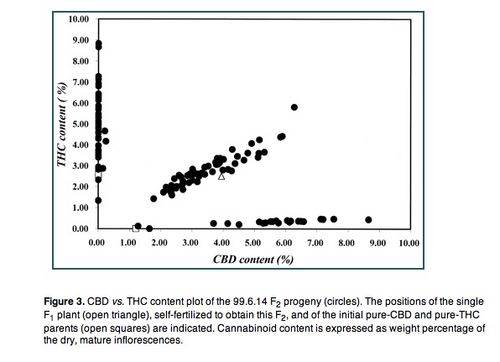
The acronym QTL refers to Quantitative Trait Locus. A QTL is a chromosomal region suspected to contain a gene (or cluster of genes) that contributes to the variation observed at a quantitative trait. QTLs are detected through QTL mapping experiments. In crop plants, these experiments utilize experimental pedigrees, usually produced from crossing two inbred lines. A commonly used QTL mapping pedigree is the F2 pedigree. The first offspring generation (the F1), resulting from the crossing of the two parental inbred lines, is uniformly heterozygous. However, in the second generation (the F2), formed by intermating among the F1, the parental alleles are segregating and most chromosomes will be recombinant mixtures of the parental chromosomes. Genes and genetic markers that are close together on a chromosome will tend to co-segregate in the F2 (the same allele combinations that occurred in one of the parents will tend to occur together in the offspring). The closer together are two markers or genes on a chromosome, the less likely the parental alleles at the two loci will be split up in the F2 as a result of recombination. This will lead to a statistical association between a gene segregating for alleles that have a measurable difference in their affect on a quantitative trait and segregating alleles at closely linked marker loci. QTLs can thus be localized to specific chromosomal segments if the trait is measured in all the F2 offspring and if all of these offspring are genotyped at hundreds of genetic markers covering the whole genome.

What is association mapping?
As in QTL mapping, the goal of association mapping is to find a statistical association between genetic markers and a quantitative trait. However, in association mapping, the genetic markers usually must lie within (or directly upstream or downstream of) candidate genes suspected to contribute to the variation in that trait, and the goal is to identify the actual genes affecting that trait, rather than just (relatively large) chromosomal segments. Therefore, in order to perform association mapping, you must first make educated guesses as to which genes are likely to have a major effect on the particular trait of interest. In further contrast to QTL mapping, which is performed in the context of a pedigree, association mapping is performed at the population level: the genotypes of the candidate gene markers and the phenotypes of the corresponding trait are determined in a set of unrelated or distantly-related individuals sampled from a population. Association mapping relies on linkage disequilibrium (LD) between the candidate gene markers and the actual causative polymorphism in that gene (i.e., the actual polymorphism that causes the differences in the phenotypic trait). Hence association mapping is also referred to as 'LD mapping'. In natural populations LD will typically extend only short distances - usually less than 1500 bp in maize (Gaut & Long 2003). This is why you must have genetic markers either within or directly upstream or downstream of a candidate gene in order for assocaition mapping to be successful (and the candidate gene must in fact have a measurable effect on the trait). Since population genetic structure (genetic differences that accumulate between isolated populations) can cause LD even at loci that are on different chromosomes, association analyses must account for population genetic structure whenever it is present in the population from which your sample has been drawn (Pritchard et al. 2000; Thornsberry et al. 2001).

What are the main distinctions between QTL and association mapping?
The main differences between QTL and association mapping are: (1) the level of resolution (in terms of distance along the DNA or chromosome), and (2) the level of generality (in terms of the number of traits that can be studied with a given set of markers). (1) QTL analyses resolve the locations of genes (or gene clusters) influencing a trait down only to the level of chromosomal segments between one to 20 cM in size (roughly one million to 20 million base pairs). Association analyses, in contrast, can provide roughly three to four orders of magnitude finer resolution on the chromosomal scale, down to the level of the actual causative gene (i.e., within thousands, or even hundreds, of base pairs). (2) QTL experiments are more general than association analyses in the sense that, in a QTL experiment, the same set of marker genotypes from a pedigree can be used to examine a wide variety of traits, the only requirements being that the trait is variable in the offspring and that some of this variation is due to fairly strong genetic effects from a limited number of genes or chromosomal segments. Further, in a QTL study, which genes the genetic markers used come from (or whether ithe markers come from genes at all) is irrelevant: all that matters is that the markers provide near complete coverage of the genome, without any large gaps (usually about 300 markers will suffice). Hence the same set of markers can be used for many different traits in a QTL analysis. Association analysis, in contrast, is "tailor-made" for specific traits, and the markers that we use in an association analysis must come from candidate genes thought to affect that trait. Each trait will have its own specific set of candidate genes.
Another contrast between the two approaches is the level of control over extraneous factors that can lead to false-positive or confounding results. In association analysis, extraneous factors such as population genetic structure or population history, if not properly accounted for, can cause false-positive results. In QTL analysis, the use of experimental pedigrees provides much greater control over such factors. However, improvement of statistical approaches to association analysis to better account for such factors is an active area of research, both within this project (see TASSEL) and elsewhere.

What are RILs?
The acronym RIL stands for Recombinant Inbred Line. These are produced to form a permanent and stable QTL mapping resource. In the first step of the development of RILs, two parental inbred lines are crossed (mated) together to form a uniformly heterozygous F1 generation. The F1 are intermated (or selfed) to form an F2 generation; most individuals in the F2 will contain recombinant chromosomes resulting from crossovers between the two purely parental chromosomes present in each F1 plant. The parental alleles are said to be segregating in the F2 generation, since it is a matter of chance just which of the three combinations of parental alleles (A/A, A/B, or B/B) will occur in a given F2 plant. Numerous individuals from the segregating F2 generation then serve as the founders of corresponding RILs. Each subsequent generation of a given RIL is formed by selfing in the previous generation and with single seed descent. In this manner each RIL, after several generations, will contain two identical copies of each chromosome, with most of them being recombinant. Each individual RIL will contain a different mix of recombinant and parental chromosomes, with a unique set of recombination breakpoint locations across the genome. Taken as a group, the set of RILs form a segregant QTL mapping population which can be stably regenerated year after year via single seed descent.

How will the RILs generated in this project be useful?
The Panzea project has generated a set of 5000 RILs grouped into 25 populations. The 25 RIL populations were derived from the F2 of crosses between the elite inbred line B73 and 25 other diverse inbred maize lines (a list of the 25 diverse maize inbred lines can be obtained here). This set of 5000 RILs, (along with the pre-existing IBM RIL population derived from a cross of B73 and Mo17) will form a permanent QTL mapping resource for the maize community. These RILs are also referred to as our "maize Nested Association Mapping population" (see What is NAM? below). By the end of this project, these 5000 RILs (and the IBM mapping population) will have been genotyped at more than 1000 SNPs from both randomly chosen and candidate genes. These SNP genotypes will provide comprehensive coverage of the genome for the purpose of QTL mapping. Hence, any maize researcher interested in performing a QTL analysis in these RIL populations will not need to do any further genotyping. They will only need to acquire the seed, plant it out in the field (in an appropriate experimental design) and then measure their phenotypic traits of interest. The seed for these 5000 RILs will soon be available from the Maize Genetics COOP Stock Center. We are currently (winter & summer of 2007) bulking up the RIL seed in plantings. Information on the potential to score your own speciaty traits in our plantings of these RILs is available here.

How were the parental lines of the 25 RIL populations chosen?
The common parental line used in all 25 families is B73, the most important and widely deployed elite inbred line in U.S. production corn agriculture. Hence, the Panzea project will provide an unprecedented understanding, via QTL mapping, of the genetic basis of the agronomic superiority of the B73 line. The remaining parental inbred lines were chosen either on the basis of their agronomic importance in the U.S. or to capture as much of the genetic diversity present in maize as possible. The addtional constraint of not being maladapted to U.S. environmental conditions was also applied. These choices were made based on DNA marker data across 94 microsatellite (SSR) loci genotyped in a broad set of 260 temperate, subtropical and tropical maize inbred lines, and on the basis of agronomic performance of the same 260 lines in plantings in Florida and North Carolina (Liu et al. 2003). The broad sample of diversity captured in our RIL germplasm resource will provide the maize research community with the opportunity to map genes involved in almost any trait of agronomic or scientific interest.

What is Nested Association Mapping (NAM)?
Our collection of 5000 RILs in 25 populations (plus the pre-existing IBM RIL population derived from a cross of B73 and Mo17) is collectively referred to as our "maize Nested Association Mapping (NAM) population". NAM is a new approach to the mapping of genes underlying complex traits, in which the statistical power of QTL mapping is combined with the high (potentially gene-level) chromosomal resolution of association mapping. The RILs are "nested" in the sense that they all share a common parent, B73, but each population has a different alternate parent. The NAM strategy consists of genotyping a feasible number of (e.g., about 1000-2000) common parent specific SNPs in the entire mapping population, in combination with much higher resolution genotyping of the 26 parents (e.g., by sequencing the entire genome of all 26 parents). The common parent specific SNPs are either present only in B73 or are present in B73 and rare in the other parents. These are used to classify each chromosomal segment that they define in each RIL according to whether it derives from B73 or from the corresponding alternate parent. In this manner, the high resolution genotypic sequence data can be projected from the parents onto the RIL offspring, without the need to sequence all the offspring. An association analysis can then be performed across the entire population. This takes advantage of historical recombination in the ancestors of the 26 parents in order to map the genes responsible for a given trait, potentially down to gene-level resolution.


References
Doebley, J. F., 1990 Molecular evidence and the evolution of maize. Economic Botany 44(3, supplement): 6-27.

Gaut, B.S. and A.D. Long, 2003 The lowdown on linkage disequilibrium. Plant Cell 15: 1502-1506. [Article]

Liu, K., M.M. Goodman, S. Muse, J.S.C. Smith, E.S. Buckler, and J. Doebley, 2003 Genetic structure and diversity among maize inbred lines as inferred from DNA microsatellites. Genetics 165: 2117-2128. [Article]

Matsuoka, Y., Y. Vigouroux, M.M. Goodman, J. Sanchez G., E. Buckler and J. Doebley, 2002 A single domestication for maize shown by multilocus microsatellite genotyping. Proceedings of the National Academy of Sciences USA 99: 8060-8064. [Article]

Pritchard, J.K., M. Stephens, N.A. Rosenberg and P. Donnelly, 2000 Association mapping in structured populations. American Journal of Human Genetics 67: 170-181. [Article]

Thornsberry, J., M. Goodman, J. Doebley, S. Kresovich, D. Nielsen and E. Buckler, 2001 Dwarf8 polymorphisms associate with variation in flowering time. Nature Genetics 28: 286- 289. [Article]

Wright, S.I., I. Vroh Bi, S.G. Schroeder, M. Yamasaki, J.F. Doebley, M.D. McMullen and B.S. Gaut, 2005 The effects of artificial selection on the maize genome. Science 308: 1310-1314. [Article]
 

Grat3fulh3ad

The Voice of Reason
Veteran
Here's an abstract, and the link to the full paper, of some more excellent pertinent reading material...

Haplotype Probabilities for Multiple-Strain Recombinant Inbred Lines
Recombinant inbred lines (RIL) derived from multiple inbred strains can serve as a powerful resource for the genetic dissection of complex traits. The use of such multiple-strain RIL requires a detailed knowledge of the haplotype structure in such lines. BROMAN (2005) derived the two- and three-point haplotype probabilities for 2n-way RIL; the former required hefty computation to infer the symbolic results, and the latter were strictly numerical. We describe a simpler approach for the calculation of these probabilities, which allowed us to derive the symbolic form of the three-point haplotype probabilities. We also extend the two-point results for the case of additional generations of intermating, including the case of 2n-way intermated recombinant inbred populations (IRIP).

RECOMBINANT inbred lines (RIL) can serve as powerful tools for genetic mapping. An RIL is formed by crossing two inbred strains followed by repeated matings among relatives (e.g., selfing or sibling mating) to create a new inbred line whose genome is a mosaic of the parental genomes. As each RIL is an inbred strain and so can be propagated eternally, a panel of RIL has a number of advantages for genetic mapping: one need genotype each strain only once; one can phenotype multiple individuals from each strain to reduce individual, environmental, and measurement variability; multiple invasive phenotypes can be obtained on the same set of genomes, including measurements on a single invasive phenotype over time or in different environments; and, as the breakpoints in RIL are more dense than those that occur in any one meiosis, greater mapping resolution can be achieved.
Members of the Complex Trait Consortium have recently begun the development of a large panel of eight-way RIL in the mouse (THREADGILL et al. 2002; COMPLEX TRAIT CONSORTIUM 2004). An eight-way RIL is formed by intermating eight parental inbred strains, followed by repeated selfing or sibling mating to produce a new inbred line whose genome is a mosaic of the eight parental strains. (Figure 1, A and B, illustrates the production of eight-way RIL by selfing and sibling mating, respectively.) This panel will serve as a valuable community resource for mapping the loci that contribute to complex phenotypes in the mouse.
n general, one might consider the development of a panel of 2n-way RIL, mixing the genomes of 2n different inbred lines. One might also consider an additional generation of interbreeding, preceding the process of inbreeding, to increase the density of breakpoints on the final RIL; we call this the RIL+ design. In 2n-way RIL, inbreeding begins with individuals at generation n; in 2n-way RIL+, two Gn individuals from independent "funnels" (with initial crosses in the same order, but with no shared recombination events) are crossed, and inbreeding begins at generation n + 1. The production of eight-way RIL+ by selfing and sibling mating is shown in Figure 1, C and D, respectively. Note that in eight-way RIL+, one may mate cousins at generation G2, as these individuals have no shared recombination events. For higher-order RIL+, a more extensive set of matings will be required to ensure that the individuals at generation Gn–1 exhibit independent recombination events.

Further, it has been proposed to include some number of generations of random mating prior to inbreeding, a design that has been called an intermated recombinant inbred population (IRIP). Multiple designs for the formation of 2n-way IRIP might be considered. First, one might create an unlimited population of individuals at generation n, each from a funnel having initial crosses in the same order, but with such crosses completely independent between individuals. Second, the individuals at generation n might each come from an independent, random funnel, with the order of the initial crosses completely randomized, though with all 2n parental strains represented. We focus on the latter design, as it requires the formation of a single large population from which a panel of IRIP may be developed. The former design would require separate populations of intermating individuals for each line to be formed. Note that the use of random funnels makes the IRIP design distinct from the RIL+ design, which uses a fixed funnel.

The use of multiple-strain RIL panels will require a detailed understanding of the haplotype structure in such lines. At any given genomic position, an RIL will be homozygous for one of the 2n possible parental alleles; a haplotype is the set of alleles at linked loci along a chromosome. We seek to understand the pattern of exchanges among the parental alleles along an RIL chromosome. In particular, the decision of whether to include additional generations of intermating should be based upon an understanding of the additional mapping precision that such intermating will provide.

The seminal article of HALDANE and WADDINGTON (1931) provided the basic results for the standard two-way RIL by selfing or by sibling mating: they derived both two- and three-point haplotype probabilities (i.e., the probabilities for all possible two- and three-locus haplotypes) for such two-way RIL. WINKLER et al. (2003) calculated the two-point haplotype probabilities for the case of two-way IRIP. BROMAN (2005) derived the two- and three-point haplotype probabilities for four- and eight-way RIL, though with enormous computational effort. Only numerical results were provided for the three-point probabilities.

Here, we improve on the work of HALDANE and WADDINGTON (1931) and BROMAN (2005). We describe a simpler approach for the calculation of two- and three-point probabilities in 2n-way RIL, which allowed us to determine exact formulas for the three-point probabilities. We also extend the results on two-point haplotype probabilities for the case of 2n-way RIL+ and 2n-way IRIP. Our results on the map expansion obtained in each design will provide a useful guide to investigators considering the development of 2n-way RIL and considering whether additional generations of intermating should be performed.

http://www.genetics.org/cgi/content/full/175/3/1267


If you notice in the chart, the RIL which was uniform for all eight traits was achieved much more quickly through sibling mating that from selfing.
 
Status
Not open for further replies.
Top