What's new
  • Happy Birthday ICMag! Been 20 years since Gypsy Nirvana created the forum! We are celebrating with a 4/20 Giveaway and by launching a new Patreon tier called "420club". You can read more here.
  • Important notice: ICMag's T.O.U. has been updated. Please review it here. For your convenience, it is also available in the main forum menu, under 'Quick Links"!

FM principle to find Delta 9 THC

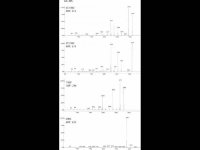
Used gear is finnicky but the unit does indeed work. In this short analysis methanol is used as the solvent. Delta 9 has several wavelengths of light that it is known to absorb and is fairly close to Delta 8 and to CBN. The granddaddy marker of THC though is found at 299 nm (UV) on the light spectrum. Google "light spectra" and you can relate a "nm" rating to a color. You will see 299 nm is on the far Side of the spectra opposite infrared (IR). Each molecule absorbs light at specific unique wavelengths. Once these wavelengths are known, the compound can then be spotted in a solution. This device marries up nicely to my liquid chromatography experiments! I can scan each fraction and get a precise picture about what is in it. Since I am interested mostly in just THC, if the fraction that elutes shows no peak at 299 nm, then I know with certainty there is no THC in the sample - it gets flushed...lolz.

This is a dual beam spectrophotometer capable of scanning 190nm-1100nm at 1 nm increments. The unit identifies peaks and valleys for the operator.

There are NUMEROUS modes that really buff this thing out but for me just being able to shine a "light" on something and see THC is constitutes an area of science known long by me to fall into the FM (Fucking Magic) range of discoveries... enjoy.

https://www.youtube.com/watch?v=mxOPJ1D44Wg
 

I only make assumptions really, however this is the reference I currently employ (Image attached to reply). Since I can judge the presence of THC Delta 9 by the effect it has, I can at least be sure THC is present. Since only Delta 9 shows a unique absorbance at 299 nm, I look for this and in fact find a spike at that specific wavelength. Assuming my reference is correct and the absorbance spike seen at 299 nm on their charts is valid data, then the instrument seems to be confirming the strong presence of Delta 9 THC. Delta 8 shares an absorbance spike at 314 nm but not at 299 nm. CBN is very close with a spike at 295 nm and is easily detected by the instrument in single wavelength mode.The instrument here can read in 1 nm increments and if you look at the chart showing absorbance spikes rather than spectrum scan curves if becomes a little mose precise as to what is contributing to the curve that is plotted from the spike data.

There are other ways to cross check the data by using a procedure known as spiking the sample, or versions of it, that work from a known standard of a pure compound, but that procedure is too complex to fiddle with for my purposes for a test this.
 

Attachments

  • IMG_1097.jpg
    IMG_1097.jpg
    16.3 KB · Views: 12
I want to point out also that the chart you posted is the same data however it appears to be presented in a format that is the mirror image of an absorbance plot like I posted. Your data references the computed "transmittance" (%T), rather than the "absorbance" (%A) that my chart references. This instrument can be set to display either, but at first glance your data posted also seems to be confirmed as accurate and seems to agree with the results in my video. Just reverse the peaks and valleys and those graphs will likely be plotted close to the spikes on the reference that I use.
 

G.O. Joe

Well-known member
Veteran
Assuming my reference is correct and the absorbance spike seen at 299 nm on their charts is valid data, then the instrument seems to be confirming the strong presence of Delta 9 THC. Delta 8 shares an absorbance spike at 314 nm but not at 299 nm. CBN is very close with a spike at 295 nm and is easily detected by the instrument in single wavelength mode.

I want to point out also that the chart you posted is the same data however it appears to be presented in a format that is the mirror image of an absorbance plot like I posted. Your data references the computed transmittance (%T), rather than the absorbance (%A) that my chart references.

The weight of the mass fragments from a MS - from the same paper - could not be more unrelated to UV. It would be wise to obtain pure standards for calibration.

What I posted is absorbance not transmittance, with extinction coefficients figured, the exact maxima are printed right there and correspond with the tall peak and shoulder and other work. Hazekamp also charted the UV absorbance from the HPLC DAD in both acid and basic eluent.


Have another.

picture.php
 
The weight of the mass fragments from a MS - from the same paper - could not be more unrelated to UV. It would be wise to obtain pure standards for calibration.

What I posted is absorbance not transmittance, with extinction coefficients figured, the exact maxima are printed right there and correspond with the tall peak and shoulder and other work. Hazekamp also charted the UV absorbance from the HPLC DAD in both acid and basic eluent.

[URL=https://www.icmag.com/ic/picture.php?albumid=13921&pictureid=1783096&thumb=1]View Image[/URL] [URL=https://www.icmag.com/ic/picture.php?albumid=13921&pictureid=1783097&thumb=1]View Image[/URL]

Have another.

View Image

I am still unclear how this chart is unrelated to the absorbance spectra seen at 299 nm in the video? I am unsure what you are attempting to communicate here. Are you disputing my data, or my conclusions, or just disputing in a general way?

If you have more tangible data generated through your own efforts, please post a video so we can compare the two. My prediction is that most of my measurements and data will be improved upon and I look forward to this. Refuting data in an observable fashion has more meaning than interpretting the wisdom of another.

As for me, I believe that my chart accurately reflects what I observed on my instrument.
 

SkyHighLer

Got me a stone bad Mana
ICMag Donor
Veteran
I only make assumptions really, however this is the reference I currently employ (Image attached to reply). Since I can judge the presence of THC Delta 9 by the effect it has, I can at least be sure THC is present. Since only Delta 9 shows a unique absorbance at 299 nm, I look for this and in fact find a spike at that specific wavelength. Assuming my reference is correct and the absorbance spike seen at 299 nm on their charts is valid data, then the instrument seems to be confirming the strong presence of Delta 9 THC. Delta 8 shares an absorbance spike at 314 nm but not at 299 nm. CBN is very close with a spike at 295 nm and is easily detected by the instrument in single wavelength mode.The instrument here can read in 1 nm increments and if you look at the chart showing absorbance spikes rather than spectrum scan curves if becomes a little mose precise as to what is contributing to the curve that is plotted from the spike data.

There are other ways to cross check the data by using a procedure known as spiking the sample, or versions of it, that work from a known standard of a pure compound, but that procedure is too complex to fiddle with for my purposes for a test this.


What is the source for the image attached to this post?
 
What is the source for the image attached to this post?

The image is contained in my lab notes on my ipad, but damned if I saved the specific site on Researchgate.net that presented this data. As I recall I did a search on "cannabinoid spectral data" or similar on that site. I love that place! This site, unlike Wikipedia say, is peer reviewed and excludes comments from those not in acedamia. Unlike acedamia (in fact the reverse of it) this site charges no $$$ for the information it shares.

I get virtually all of my own reference material from that site when it comes to the more specific data like this which seems to correlate to what I have observed by direct observation.

I can easily create a purity approaching absolute, which is not shown (yet) in the boiling flask the sample came from. Upon the third molecular distillation run I obtain a pale yellow compound that gets me high as a kite. My internal THC sensor spikes when I start to giggle and damned if that isn't right where the chart says I should start giggling... a sure indicator that this stoner has more to be proud of than passing high school with a D- average; my families record for achievment... No studies on researchgate though yet about morons with intruments and tools....🤓

I presented my findings and as much reasonable data as is meritted here. If you find them useful then great. If not, great. We are all children of the same universe even if we speak different dialects. I have removed multiple videos (dozens) from public sites when I learn there is an inherent flaw in my methodology or data. I will monitor this topic and if I discover my data is presenting information that is in error then I will remove it and add that to my notes too.

Then I will move on.
 

SkyHighLer

Got me a stone bad Mana
ICMag Donor
Veteran
To have one's error exposed by G.O. Joe is an honor.

Speaking of which, Wikipedia finally revised their stated THC boiling point data and reference,

Boiling point 155-157°C @ 0.05mmHg,[7] 157-160°C @ 0.05mmHg[8]

7. Gaoni, Y.; Mechoulam, R. (April 1964). "Isolation, Structure, and Partial Synthesis of an Active Constituent of Hashish". Journal of the American Chemical Society. 86 (8): 1646–1647. doi:10.1021/ja01062a046.

8. Adams, Roger; Cain, C. K.; McPhee, W. D.; Wearn, R. B. (August 1941). "Structure of Cannabidiol. XII. Isomerization to Tetrahydrocannabinols". Journal of the American Chemical Society. 63 (8): 2209–2213. doi:10.1021/ja01853a052.

https://en.wikipedia.org/wiki/Tetrahydrocannabinol
 

G.O. Joe

Well-known member
Veteran
What is the source for the image attached to this post?

Chromatographic and Spectroscopic Data of Cannabinoids from Cannabis sativa L. by Arno Hazekamp, Anja Peltenburg, and Rob Verpoorte.

I am still unclear how this chart is unrelated to the absorbance spectra seen at 299 nm in the video? I am unsure what you are attempting to communicate here. Are you disputing my data, or my conclusions, or just disputing in a general way?

If you have more tangible data generated through your own efforts, please post a video so we can compare the two.

No one has to do any analyses to see that you don't know the difference between m/z from a MS and nm from a spectrophotometer, and don't care to know any time soon. The charts I posted show little THC absorbance at 299 nm certainly not a peak, and I just plain dispute everything you have to say, but don't care much. If you are saying you have something with a maxima at 299, this is proof that it isn't pure THC. Maybe it has THC in it, but whatever is in it has a maxima at 299. This is assuming there is nothing wrong with your solvent, machine, and cuvette. The last chart shows the difficulty in quantifying THC by UV in the presence of traces of CBN.

I wish my spectrophotometer measured UV but it's a much cheaper visible only model, useful for determination of the particular chromophore formed from a cannabinoid and Fast Blue, once calibration curves from analytical standards have been determined of course. My LC-MS is short one $1000 DAD flow cell, and nitrogen generator. Bong hit for 420.
 
Chromatographic and Spectroscopic Data of Cannabinoids from Cannabis sativa L. by Arno Hazekamp, Anja Peltenburg, and Rob Verpoorte.


No one has to do any analyses to see that you don't know the difference between m/z from a MS and nm from a spectrophotometer, and don't care to know any time soon. The charts I posted show little THC absorbance at 299 nm certainly not a peak, and I just plain dispute everything you have to say, but don't care much. If you are saying you have something with a maxima at 299, this is proof that it isn't pure THC. Maybe it has THC in it, but whatever is in it has a maxima at 299. This is assuming there is nothing wrong with your solvent, machine, and cuvette. The last chart shows the difficulty in quantifying THC by UV in the presence of traces of CBN.

I wish my spectrophotometer measured UV but it's a much cheaper visible only model, useful for determination of the particular chromophore formed from a cannabinoid and Fast Blue, once calibration curves from analytical standards have been determined of course. My LC-MS is short one $1000 DAD flow cell, and nitrogen generator. Bong hit for 420.

Perhaps you can borrow somebody elses stuff and post corrected data with a machine that has the same capabilities as mine? After all, the original post was about my instrument producing a spectral scan. Why don't you make a chart for yourself and apply your own wisdom to the problem? Confirm your own hypothesis by direct observation of your own work, which is infinitately more difficult than flaming a post about somebody else's, right? I am sorry if I bruised your ego. My intent was to share knowledge, and not to piss you off personally lolz. Grow up.

Good luck sport.
 

G.O. Joe

Well-known member
Veteran
This is why I've avoided responding to your posts - this could be the only outcome as if by script. All I did was put it in the most delicate way, yet this was still unavoidable.
 

G.O. Joe

Well-known member
Veteran
I don't deserve any undeserved credit at all. That homework and a plan went well, all respect goes to sadpanda. TLC with maybe the anisaldehyde-sulfuric acid visualization reagent mentioned there could have come in handy here to indicate purity, if that was a goal. Gene O. might post here one last time - you'll have to log in to a different site to view it - he'll be plotting something like that last graph? Maybe that's what he did in this one, but he didn't say much here. Absorbance pickup at 299-300 certainly does maybe indicate THC - when it's just the lowest amount definite beginning/end of it.
 
Top