What's new

Cannabis absorptance spectra: calculated and compared

Here's a nice one.

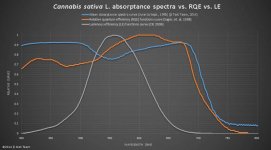
This graph shows the mean of Cannabis absorptance from two tests in vegetative stage and two in flowering stage, each test was 3 to 5 weeks apart. That mean is compared to the RQE curve of higher plants (same as before), but this time we added the 2008 CIE luminous efficiency curve (which represents how human eyes use light).

More graphs to come.

[NOTE 10-7-2014: This graph is from older data that we have since adjusted slightly. This graph will be updated as we have time.]
 

Attachments

  • Cannabis sativa L. absorptance vs. RQE vs. LE.jpg
    Cannabis sativa L. absorptance vs. RQE vs. LE.jpg
    31.8 KB · Views: 48
Last edited:

magiccannabus

Next Stop: Outer Space!
Veteran
50 posts is easy to reach if you just go talk to people in some of their threads. Took me two days, and only because I wasn't really in a hurry.
 

mofeta

Member
Veteran
Hey you are back!

Looks like you have been busy. Hope everything is going well.

How did the DH thing work out?

Good to see you around.

mofeta
 
To be used to compare spectral qualities of light sources (HID, LED array, sun, etc.), in terms of potential to grow Cannabis.

In simple terms, we made these absorptance spectra so we can weight McCree's yield photon flux (YPF), as adjusted by Sager, et. al., with Cannabis absorptance rather than its current generalized higher plant absorptance spectra. See the first two posts for info on what YPF is, if you're not familiar.

In complex terms:
- Quantum yield = K2(action spectrum)/(λ nm * absorptance)
- RQE = quantum yield normalized to 1
- So, what we're going to do is deweight RQE (from Sager, et. al., 1988) by McCree's generalized plant absorptance spectra by λ nm, then use our Cannabis absorptance spectra to reweight RQE by λ nm. In this way YPFc (what we term YPF for Cannabis) will be more accurate to how Cannabis uses light for photosynthesis than just using normal YPF.

These data will be incorporated into a spreadsheet workbook we're working on. This workbook will provide YPF and YPFc of the light source from the SPD and from canopy light measurements with a luxometer or quantum sensor.

We're updating knna's spreadsheet and adding lots of new features, like the action spectrum of UV-b and UV-a (Flint and Caldwell, 2003), so we can use that to apply UV-b to Cannabis to increase THC (from past published research).

As well as YPF and YPFc, growers can use a luxometer to find out PPF (PAR intensity) and DLI (daily light integral) their plants are getting while they're growing (indoor or outdoor). (Using interconversion functions.) So growers don't need to spend around $1,000 to be able to properly measure light for plants, and they can make sound decisions based upon those data by spending maybe $100 to $200 on a good luxometer.

There's so much that can be done with our spreadsheet we're working on it's hard to post about it now. Once the spreadsheet is done, hopefully this weekend (we've been working on it for 3 weeks now), we'll release it and things should become clear.

Right now people are only seeing 1/3 of a puzzle, so it's still confusing. Once you get to see the other 2/3's of the puzzle (two more spreadsheets) it should be a nice picture that's easy to recognize.

We have already written a spreadsheet we could release now that guides the user to normalize their SPDs such that each X-axis pixel is the same width as each λ nm as represented on the SPD (so they can be analyzed). But we want to wait until the last spreadsheet is completed, then release both at the same time.

The main spreadsheet we're writing is called Spectral-System Energy and Canopy Irradiance Analyzer ("SSECI Analyzer" for short). The component spreadsheet to our SSECI Analyzer is called "SPD Pixel to nm Normalization Assistant."

If you want a sneak-peak about what we're doing and updating, read the threads knna wrote back in 2006 and 2008, see the first post in this thread for the Google search terms.
 
Hey, we can both work on our postcount :)

To get 3D measurements you don't need to take them, you can also calculate them.
Then try to input the effects of the canopy, reflector and sweetspot.
Of course actual measurements would be better, but this is already an improvement.


What do you think of this:

223874d1248665458-building-led-lights-facts-no-theories-fig%2520tik%25204.jpg
 
You have 18 posts since 2009? Including that one and the other one you sent me? You better hurry up, you'll never got to 50 before you die!

I don't know what you mean by "3D measurements." Are you referring to photon fluence (photons striking a spherical surface)? Or maybe inverse square law of a point source (like a lamp's arc tube or LED)?

I'm not sure what to think about that figure you posted without its context, I believe it's from NASA-CP-95-3309.

I don't really see what this has to due with this thread, but there is an old study on Cannabis that looked at effects from filtered sunlight as only blue, green, and red; and the growth and THC content was much different under each treatment. However, the study was pretty flawed in a few important ways, so we don't think there's much to be taken from its data or findings.
 
I'm not sure what to think about that figure you posted without its context, I believe it's from NASA-CP-95-3309

It's Tikhomirov. He measured action spectra as time went along. I suspect he used a lot of blue light and part of what we see is photo adoption. What's CP, Colombian Pot?

I don't know what you mean by "3D measurements." maybe inverse square law

That's one thing. Measurements are taken at 1M, but we hang our lamps closer than that. The bigger the difference the more blue will be in the spectrum.

Beam characteristics are also different between lamps:

minibeamcompacts.jpg


minibeammercvapspot.jpg


and impacted a lot by reflectors that dramatically change the output and spectrum as well.
 
Photoadaptation also came to my mind looking at that figure, though it doesn't (to me, at least) explain the graphed data points (we need more context). I know I've read that work but I don't recall the specifics. Not sure if he used white light.

Yep, the light that reaches the plants at canopy (especially when using a reflector with glass heat shield and a horizontal lamp) in terms of uniformity of irradaince (PPFD) and even light quality (spectrum, for example regarding photon absorption by reflector insert, glass shield, and walls) is not possible to accurately characterize from only source radiant energy data (such as lamp's rated lumens).

If the lamp was used without a reflector, and we knew the distance to canopy, and we're not accounting for reflection from walls, etc., then using the inverse square law (assuming it's a point source light) works well.
 
we need more context

It's the photosynthetic rate of cucumber per canopy area for PAR irradiances of 100 W m-2 with 400-500nm (B), 500-600nm (G), or 600-700nm (R) during canopy development. It's from a Russian piece in 1991 "Spectral composition of light and plant productivity". Tikhomirov is the Russian counterpart of McCree and did a lot of interesting research, expanding on McCree's and Inada's earlier work (I know you know that). "The curve for action spectrum of photosynthesis is not correct in light regulation under long-term stationary regimes, since certain reactions to spectrum and intensity of PAR aren't taken into consideration. All spectral requirements obtained under short light influence tests have similar limitations".

not possible to accurately characterize (PPFD) from only source radiant energy data (such as lamp's rated lumens).

That's exactly why 3-D measurements are needed.

If the lamp was used without a reflector, and we knew the distance to canopy

The effects of reflectors are known and could be modelled, just like the distances to the canopy that are all standard.
It is possible to make measurements more accurate just by theory, but of course by practice is much better and easier.

Here is another interesting graph:


Fig%20Tik%203.jpg


May be we only need so much red to make the plants sleep well, which indeed helps them flower?
 

shaggyballs

Active member
Veteran
So Beta will You be breaking down all this fantastic scientific evidence for us mentally challenged to better understand.

Like cannabis likes XXX nm for seeds/clones, xxx nm for early veg, xxx nm for late veg, xxx nm for early flower, xxx nm for late flower, and xxx nm for ripening?

And what about morning and high noon and dusk what NM work best in these specific situations.

I am a carpenter by trade.....so dumb it down a little if you can please.
You may post in my grow threads in my sig to get your count up.
HERE

And HERE

I hope to be using LED with a flexible spectrum before it finishes.

shag
 
It's the photosynthetic rate of cucumber per canopy area for PAR irradiances of 100 W m-2 with 400-500nm (B), 500-600nm (G), or 600-700nm (R) during canopy development. It's from a Russian piece in 1991 "Spectral composition of light and plant productivity". Tikhomirov is the Russian counterpart of McCree and did a lot of interesting research, expanding on McCree's and Inada's earlier work (I know you know that). "The curve for action spectrum of photosynthesis is not correct in light regulation under long-term stationary regimes, since certain reactions to spectrum and intensity of PAR aren't taken into consideration. All spectral requirements obtained under short light influence tests have similar limitations".
Thanks for the context :)

Yea, I agree, there is a lot of work that needs to be done to fully understand how plants use PAR light instantaneously and over time. Right now the scientific community is working on that issue.

The McCree RQE is not really that accurate, considering it was created with only 150 PPFD and near-monochromatic wavebands (25 nm ranges, if I recall correctly). So under high irradiance it's not accurate, and lacks the synergistic effects from white light on photosynthetic rate.

Inada's work seems to be ignored (at least by Western scientists) in favor of McCree's work. It's interesting how Inada used optic watts and McCree used photons for their energy units. For our work, we're using McCree, not Inada, mostly because McCree studied photons and his work has been updated (for example, Sager, et. al., 1988) and pretty well vetted.

Beta Test Team said:
not possible to accurately characterize (PPFD) from only source radiant energy data (such as lamp's rated lumens).
That's exactly why 3-D measurements are needed.
I still don't understand what you mean by "3-D measurements." I assume you mean using a light sensor at canopy and between canopy and reflector aperture, but maybe I'm wrong?

Beta Test Team said:
If the lamp was used without a reflector, and we knew the distance to canopy
The effects of reflectors are known and could be modelled, just like the distances to the canopy that are all standard.
Yep, using something like LTI Optics (Photopia). However, it's best to take into account wall (and ideally floor and ceiling) reflectivity. (And even more accurate would be accounting for Cannabis leaf reflectance using our absorption spectra.)

There was a really good study published a few months ago, the famous Dr. Bugbee was the contributing author, that used a integrating sphere to study the most popular luminaires used by Cannabis growers, and it was very illuminating :))) [I can post a link if you want to read the study.] The study was not meant to look at luminaires used by Cannabis growers, but it did, anyway.

We are using that study I just wrote about, as well as a few other studies, and the work we're doing on our spreadsheets, for analyzation of light sources (and systems) for energy efficiency (i.e. umoles per joule).

It is possible to make measurements more accurate just by theory, but of course by practice is much better and easier.
Yes, I agree. And most people don't know how enough about the physics of light to for the calculation. That's why we're adding the Canopy Irradiance Analyzer features to our spreadsheet.

Here is another interesting graph:
View Image

May be we only need so much red to make the plants sleep well, which indeed helps them flower?
Likely, it's an interesting area for research, for sure.

We're also really interested in continuous light (24 hour, no night period), UV-B irradiance, and night-break. Those are three light treatments we're going to study in 2015, on Cannabis.

Oh yea, we're buying a photosynthetic leaf analyzer so we can study photosynthesis in Cannabis, and make a RQE for Cannabis under 500 or 1,000 PPFD. Look for that published research from us in early 2015. We're thinking about using crowdfunding like GoFundMe or KickStarter, so we can afford a really nice photosynthesis meter (more than $30K), otherwise we'll buy a sufficient model that's bare-bones.
 
So Beta will You be breaking down all this fantastic scientific evidence for us mentally challenged to better understand.

Like cannabis likes XXX nm for seeds/clones, xxx nm for early veg, xxx nm for late veg, xxx nm for early flower, xxx nm for late flower, and xxx nm for ripening?

And what about morning and high noon and dusk what NM work best in these specific situations.

I am a carpenter by trade.....so dumb it down a little if you can please.
We'll try to make everything clear, yes. The problem is we don't know how to make it clear from the start, how basic to make the info type of thing. So when people ask questions that's really helpful to us, because we can then explain further, and further, if needed, until it's understood.

Right now we don't know how to best explain what we're doing in simple (non-sciencey) terms. So when people ask us questions it helps us figure out how to better explain things.

It's hard to make info too basic, because then you loose accuracy of the info (including terms and phrases).

To your main question:
It's really quite simple for Cannbais, and you seem to be over thinking the issue. It's like I wrote to you in the your thread about light, the color of the light isn't really important, it's the amount of PAR light (as PPDF) that's important. At least in terms of photosynthesis. (Assuming it's a white light source, with sufficient blue, green, and red light distribution, which isn't specific to Cannabis.)

So what you should be concerned with is the PPDF at canopy, and the uniformity of that PPDF over the canopy. The uniformity of irradiance is where lots of growth chamber and growth room (or growth warehouse) growers mess up.

If you're using a LED array consider the uniformity of the spectrum over the canopy as well (for example, don't put all blue LEDs in one group).

The issue of PPFD uniformity is why it's very important to either have your growth room/chamber/etc modeled in 3D for how the light will react (with something like Photopia), or, use a light sensor at canopy to measure the irradiance at every X square mm over the canopy, then graph those data points to see the uniformity (or lack thereof) of irradiance at canopy.

In terms of color of light (wavelengths) for biological processes not involving photosynthesis, Cannabis isn't much different than other plants. And the spreadsheet we're writing has lots of info on these topics, such as goals for the spectral quality of the light for Cannabis growth (for example, R:Fr ratio, PPE, relative amount of blue light, green light, yellow light, etc.). We will finish the spreadsheet sometime this week, I want to wait until then to get deeper into these topics.

Again, please ask any question to have, the more people ask us things the better things can be for everyone.
 
The most basic way is to use a decent lux meter ($100 to $200), and say if your canopy is 3'x3', make that into a 6"x6" grid (better would be 3"x3" or 4"x4"), and take a reading in the center of each square (make sure the sensor is level).

For example, if you split that 3'x3' area into 1'x1' sections you would take least two measurements, better is four (or even better is 8). So if take 4 measurements per 1'x1' you would divide the 1'x1' area into 4 6"x6" areas.

Then once you have all the data look at the data for wide swings in irradiance, which should be quite easy to see as most indoor lighting Cannabis growers use is very non-uniform. Also, you can find the mean of the data to calculate an approximate irradiance for the total area.

When analyzing data like that we like to make line graphs, and that's really easy with Excel. Making graphs often makes the data easier to understand and visualize.

However, that is a less than idea method, simply because we're only working with lux, which is how human eyes use light, not plants.

The better method would be to use a decent lux meter and the spreadsheet we're working on to calculate PPDF from lux (instead of using lux). In this case you would analyze your light source's SPD with our spreadsheet to get a lumen to PPF conversion factor for your specific light source, then you could input the lux data (from the lux meter) into the spreadsheet and it reports back to you the PPFD.
 
Top