What's new
  • Happy Birthday ICMag! Been 20 years since Gypsy Nirvana created the forum! We are celebrating with a 4/20 Giveaway and by launching a new Patreon tier called "420club". You can read more here.
  • Important notice: ICMag's T.O.U. has been updated. Please review it here. For your convenience, it is also available in the main forum menu, under 'Quick Links"!

Cannabis absorptance spectra: calculated and compared

Most growers wont' spend the needed money on a quantum sensor, so a good lux meter is a really good option for most people. (We use quantum sensors, not lux meters.)

That quantum sensor you cited is not worth the price. You want a better filtered sensor. Like LI-COR (or Kipp & Zonen), which is about $400 for the sensor and about $600 for the light sensor, so that's about $1,000.

The Apgoee quantum sensors are not very accurate, they cut off a lot of the red range in PAR so you don't get a very accurate PPF. If a grower is willing to spend $400 to get an Apogee, they should cough up an extra $600 and get the LI-COR, or get a good lux meter (~$200).

It's better to use a good lux meter (because they have really good filters), and convert that lux to PPF using our spreadsheet (once the users' SPD is analyzed by the spreadsheet), to find PPF. Or, just a good quantum sensor, like from LI-COR or Kipp & Zonen, notApgoee.

Dr. Bugbee's company Apogee is good for some things, but not quantum sensors (due to the less than ideal filters they use).
 
Last edited:
LI-190SA Quantum Sensor

LI-190SA Quantum Sensor

What's your opinion on that meter, Beta?

What meter would you recommed for ~$500?
None. There are not good options in that price range (unless you buy used, like a new LI-190SA and used light sensor or data logger from Ebay.)

LI-190SA Quantum Sensor: $400
https://licor.secure.force.com/cata...T9Q4AAK&navigationStr=ListProduct&searchText=

LI-250A light meter
(to read measurements from quantum sensor): $695
https://licor.secure.force.com/cata...T9PuAAK&navigationStr=ListProduct&searchText=
 
Tom, I forgot to tell you to get the leveling base for the sesnor, so you know you're taking level readings: $55
What's your opinion on that meter, Beta?

What meter would you recommed for ~$500?
None. There are not good options in that price range (unless you buy used, like a new LI-190SA and used light sensor or data logger from Ebay.)

LI-190SA Quantum Sensor: $400
https://licor.secure.force.com/cata...T9Q4AAK&navigationStr=ListProduct&searchText=

LI-250A light meter (to read measurements from quantum sensor): $695
https://licor.secure.force.com/cata...T9PuAAK&navigationStr=ListProduct&searchText=
 
Off the top of my head I don't know. We don't use lux meters, and most brands that produce high quality quantum senors don't make lux meters. I'll send an email to a colleague who would have a good answer for you, but I may not get a response until tomorrow for you.

If you're only concerned with analyzing the light uniformity at the canopy (and would rather use a quantum senor than a lux meter) then the Apgoee brand of quality sensors would work fine. The only reason I don't like Apogee is for analyzing PPFD (irradiance), because (at last I knew) the quantum response of the sensors cut out (doesn't measure) photons ~>650 nm.
 
We're aware of that review and don't think it's useful for terrestrial use of quantum sensors. From that study:
A white plastic bucket was filled with tap water which allowed an effective depth of ~18cm for the immersed sensors during the water comparisons. The PVC pipe created remarkably little water surface agitation; however, the water was given a few seconds to 'flatten' before measurements were recorded.


Here's what an ideal quantum response for the quantum senors should be, the flat red line (counting PPFD, as unweighted PAR umoles):


Here is Apogee quantum response for the quantum senors:


And here is LI-COR quantum response for the quantum senors:


As you can see from those figures Apogee cuts off a considerable part of PAR range light, it doesn't even measure that important range. As well as it underweights blue range by not reaching 100% as show in that figure. And it overweights green and yellow. LI-COR is much more accurate to the ideal quantum response so gives a much more accurate PPFD.

"Comparison of Quantum Sensors with Different Spectral Sensitivities"
http://www.licor.com/env/pdf/light/TechNote126.pdf

We think it's telling the the owner of the company doesn't use his own quantum senors in his published research.

We own a 3' line quantum sensor from Apogee, as well as LI-COR LI-190 quantum sensor, so we can speak from experience comparing the two.

If you're happy with Apogee that's great. It's a great brand and Dr. Bugbee is an amazing scientist. :)
 

guvoo

Member
PAR Meters and LEDs - How Accurate are the Measurements? A Comparison of Three Meters and Lux to PAR Conversion Factors for LEDs
By Dana Riddle

http://www.advancedaquarist.com/2013/2/equipment


LI-192 / LI-190 different housing, thats all...

LI-192:
...
Cosine Correction:
Optimized for underwater and
atmospheric use.
....


and some old Excel sh...


another free version of this calculators
 
Last edited:
Thanks for posting that, I have not read it before. Too bad I couldn't find her materials/methods section. That review backs up what I'm writing, that the Apgoee is not as accurate as the LI-COR.

And if you look at her 'red' LED SPD you'll see its peak (and majority of energy) is <650 nm, therefore it's giving an unfair edge to Apgoee because if the peak was, say, 670 nm, the Apogee readings would be much lower.

The study you posted is flawed in the same way the study tenthirty posted is flawed, that is, skewed data due to insufficient spectral analysis. The study tenthrity posted looked at light with a lot of blue, not a lot of red, so it was skewed (for our use case), like that one you posted is skewed (due to insufficient study of red light from 600 to 700 nm).

The review you posted looked at LI-189, not LI-190. I don't know if there are filter or other differences (like cosine).

We prefer to use published studies relative to terrestrial plant growth to source data, for example:

"Accuracy of quantum sensors measuring yield photon flux and photosynthetic photon flux"
http://www.ncbi.nlm.nih.gov/pubmed/11537894

Like I wrote, if people are happy with Apgoee that's great, but the fact is it doesn't measure >650 nm. And no matter how many aquarium studies are shown it won't change that fact.

This thread is not about choosing light sensors, so lets not take it there, okay? If people are happy with Apogee, or SpecMeter, then great, use them. We do (Apogee, we would never touch SpecMeter) :)

P.S. Why did you post those two last two figures? How do they relate to you post?
 
Last edited:
Our 50th post! Let the editing begin! :)

guvoo, that study I posted, the owner of Apogee (Dr. Bugbee) is a contributing author, and they didn't even bother to study his brand of quantum sensors. This, to us, is not insignificant. Like I wrote before, Bruce never uses Apogee sensors in published studies.

We have 3' Apogee line quantum sensor, as well as LI-COR LI-190 quantum sensor. Both are very useful and both are great quality. But when we need to measure irradiance, and need accuracy, we use LI-COR.

I like Apogee brand a lot.
 
Last edited:

guvoo

Member
Ooops. I shouldn't have assumed "Dana Riddle" is a woman.

and a nice one...[FONT=Arial, Helvetica, sans-serif]
icon10.gif
[/FONT]
http://reefbuilders.com/2011/09/12/draft-dana-riddle-joins-ranks-masnas-aquarist-year-2011/
 
Almost embarrassed to say, but for measuring UVB I got a very cheap Solarmeter 6.2 on the recommendation of Frances Baines. Not sure if it is any good for our purpose.

Do you know what the sunniest place on earth is during the summer season?
 
We like Solarmeter brand. Their meter with the human skin filters (model 6.4*) is kind of close to the Flint and Caldwell UV-B and UV-A action spectrum for higher plants :)

Even the really nice UV-B sensors that are more than $2,000, like from Kipp & Zonen, are pretty inaccurate in terms of their quantum response (just like most yield photon flux sensors). So we think using Solarmeter is a fine option. There will always be a non-insignificant error margin unless something like a spectroradiometer is used.

In fact, we plan to suggest people use Solarmeter UV meter (model 5.0**) if they are using a UV-B light source that they want to analyze with our spreadsheet (and to learn canopy irradiance info). So they would input the digitized SPD for their UV-B lamp into the spreadsheet (to get a UV mW/cm-2 to PFD conversion factor), then they input the mW/cm-2 readings at canopy from the Solarmeter sensor and the spreadsheet reports backs UV-B, UV-A, and UV (total) as PFD (umol/m-2/s-1), as well as reports %UV-Bbe, %UV-B, %UV-Abe, %UV-B of PFD.

We haven't yet fully fleshed out our plans for the UV mW/cm-1 conversion from Solarmeter readings into PFD, as well as UV-Bbe and UV-Abe (using Flint and Caldwell, 2003). That's on the to-do list this week. We're thinking maybe we can account for the weighted quantum response of the Solarmeter sensor to make its use more accurate.

* https://www.solarmeter.com/model64.html
** https://www.solarmeter.com/model5.html
 
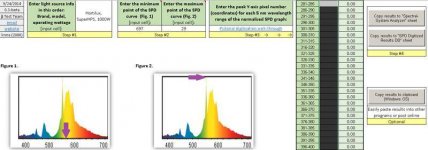
Here's a teaser about the spreadsheet I keep mentioning. These three sheets are completed, we have more work to do though.

We're calling our software "Harvest Irradiance Spectral-System Analyzer," or "HISSA," for short. Trying to make a short and catchy acronym is hard. If anyone has better names let us know!

Our plan is to release the first public beta version that only does the following three things. That will give us time to get the other features written (the Irradiance and Harvest analyzers), while users test out the current program and help us improve it (by reporting bugs, requests, suggestions, etc.), we hope :)

1. Walks the user through the process of SPD normalization

2. Walks the user through the proceeds of SPD digitization

3. The main interface, the "Spectral-System Analyzer" sheet, where the user inputs the data they created during the process of SPD digitization. After the user inputs those data the Spectral-System Analyzer sheet reports back all sorts of useful information.


These were too large originally so I cropped them quite a bit. These show the meat of each sheet. I have also attached all three to this post, in case that makes them easier to read:

SPD Normalization Assistant:


SPD Digitization Assistant:


SPD Normalization Walk-Through (very detailed pictorial guide):
 

Attachments

  • SPD Normalization Assistant screenshot.jpg
    SPD Normalization Assistant screenshot.jpg
    24.5 KB · Views: 43
  • SPD Digitization Assistant screenshot.jpg
    SPD Digitization Assistant screenshot.jpg
    38.1 KB · Views: 47
  • SPD Normalization Walk-Through.jpg
    SPD Normalization Walk-Through.jpg
    37.9 KB · Views: 41
Last edited:

3dDream

Matter that Appreciates Matter
Veteran
Am I reading your early veg, late veg, early flower, and later flower table right? It looks like the needs don't change.
 
Yes, you're reading it correctly.

For the light needs (as absorption of photons) very little changes in terms of spectrum (there are some changes, but they're all minor). If you want me to I could make up four separate graphs, one for each growth stage, as well as one with all four lines for comparison (there will be some overlap), and upload them here.

We've been meaning to make more graphs from those data but haven't yet, if someone wants them it will give us more of a reason to make them and post them.

Wouldn't take more than 20 minutes or so. Let me know.
 
Last edited:

Latest posts

Latest posts

Top