
-
Happy Birthday ICMag! Been 20 years since Gypsy Nirvana created the forum! We are celebrating with a 4/20 Giveaway and by launching a new Patreon tier called "420club". You can read more here.
-
Important notice: ICMag's T.O.U. has been updated. Please review it here. For your convenience, it is also available in the main forum menu, under 'Quick Links"!
You are using an out of date browser. It may not display this or other websites correctly.
You should upgrade or use an alternative browser.
You should upgrade or use an alternative browser.
Have you looked at the North Pole lately?
- Thread starter igrowone
- Start date
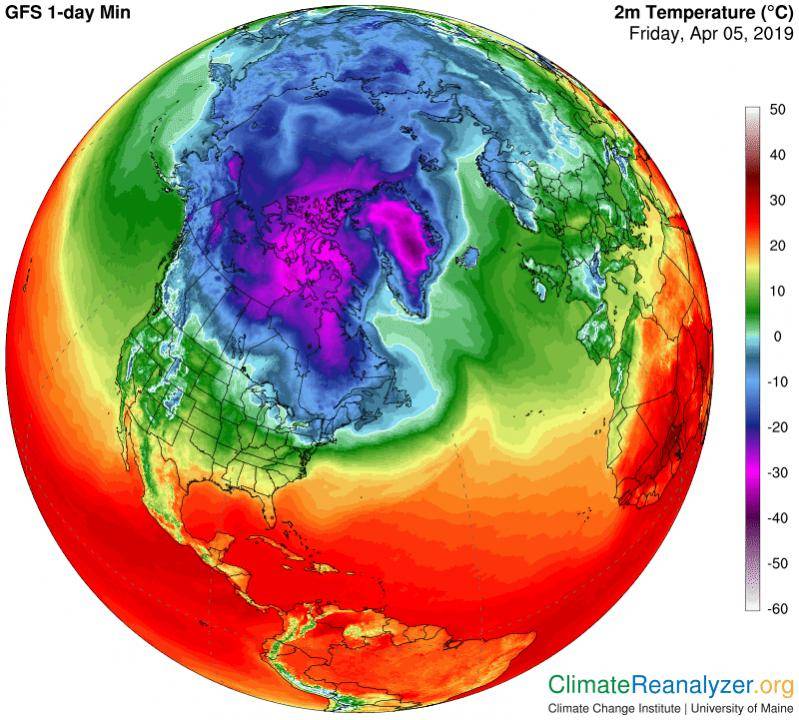
i had seen it was warm in the forecasts, but jesus!news today says areas of alaskan coastline
will be 40 degrees over normal this weekend. usually below zero, going to be above freezing. "nothing to see here folks, those polar bears can tread water for days. move along now..."
one hell of a warm spell up by the Bering sea
Public Release: 28-Mar-2019
Winds of change...Solar variability weakens the Walker cell
An international team of researchers from United Kingdom, Denmark, and Germany have revealed, that during periods of increased solar irradiance, the trade winds weaken and the Walker circulation in the tropical Pacific shifts eastwards.
Aarhus University
An international team of researchers from United Kingdom, Denmark, and Germany has found robust evidence for signatures of the 11-year sunspot cycle in the tropical Pacific. They analyzed historical time series of pressure, surface winds, and precipitation with specific focus on the Walker Circulation - a vast system of atmospheric flow in the tropical Pacific region that affects patterns of tropical rainfall. They have revealed that during periods of increased solar irradiance, the trade winds weaken and the Walker circulation shifts eastwards.
Stergios Misios, a postdoctoral researcher at the University of Oxford, said "We deal with a very short record of observations in the tropical Pacific and we must be very careful with how we filter out other interannual fluctuations. After a careful treatment of the data covering the last 60 years, we detected a robust slowdown of the Walker cell during years associated with solar-cycle maxima".
The analysis shows that, in tandem with changes in the wind anomalies, the dominant patterns of tropical precipitation shift to the central Pacific during solar-cycle maxima. As a result, rainfall decreases over Indonesia and in the western Pacific, and increases over the central Pacific Ocean.
Simple mechanisms amplify the solar signal
The issue of solar influences on climate is long and controversial as there have been numerous claims which in most of the cases did not survive proper statistical scrutiny. But besides statistical verification lies an even more challenging problem: how miniscule changes in incoming solar radiation could produce significant climate signatures?
"Soon enough, we realized that the magnitude of the wind anomalies that we detected in observations simply could not be explained by radiative considerations alone. We thought that if it comes from the Sun, there must be another mechanism that amplifies the weakening of the Walker circulation." said Prof. Lesley Gray of University of Oxford. With the aid of a global climate model, this mechanism was found in the dynamical coupling between the atmosphere and ocean circulation in the tropical Pacific.
Averaged over the globe the surface temperature imprint of solar cycle barely reaches 0.1 K in a solar maximum - almost 8 times weaker than the global warming trends observed in the 20th century. Yet, even such a weak surface warming influences the Walker circulation through changes in global hydrology. As the surface warms, water vapor in the atmosphere increases at a higher rate than is lost by precipitation, necessitating a weakening of the Walker cell. This is a well-tested mechanism in model simulations of increased CO2 concentrations but it turns out that is operating under the 11-year solar cycle, too.
S. Misios, said "Our model showed westerly wind anomalies in the Pacific region even when we considered only changes in global hydrology, but the magnitude was far too weak. We hypothesized that atmosphere-ocean coupling, essentially the Bjerknes feedback, can amplify the solar signal". Using a climate model forced by the 11-year solar cycle alone, researchers found the evidence to support their hypothesis. Their model showed much stronger wind anomalies in the Pacific of magnitude as observed. They proposed that changes in global hydrology and the Bjerknes feedback mediate solar cycle influences on the Tropical Pacific. The researchers now hope that if the interplay between those mechanisms is properly represented by other climate models, it could give potential to improve the skill of decadal predictions in that region.
https://www.eurekalert.org/pub_releases/2019-03/au-woc032819.php
Climate, Press Release
Changes in Ocean ‘Conveyor Belt’ Foretold Abrupt Climate Changes by Four Centuries
Same Atlantic Current Is Weakening Today
by Sarah Fecht|March 20, 2019
In the Atlantic Ocean, a giant ‘conveyor belt’ carries warm waters from the tropics into the North Atlantic, where they cool and sink and then return southwards in the deep ocean. This circulation pattern is an important player in the global climate, regulating weather patterns in the Arctic, Europe, and around the world. Evidence increasingly suggests that this system is slowing down, and some scientists fear it could have major effects, such as causing temperatures to dive in Europe and warming the waters off the East coast of the United States, potentially harming fisheries and exacerbating hurricanes.

A simplified diagram of the Atlantic Meridional Overturning Circulation. This ‘conveyor belt’ carries warm water from the tropics (represented by red arrows) into the North Atlantic. There, the water cools and sinks before flowing back toward the south (yellow arrows). This pattern of circulation plays an important role in regulating climate in the North Atlantic as well as the rest of the world. Image: Muschitiello et al.
A new study published in Nature Communications provides insight into how quickly these changes could take effect if the system continues weakening. Led by scientists at Columbia’s Lamont-Doherty Earth Observatory in collaboration with the Norwegian Research Centre, the study is the first to precisely determine the time lags between past changes to the ocean conveyor belt and major climate changes.
The team studied a key section of the ocean current pattern, known as the Atlantic Meridional Overturning Circulation (AMOC). They zeroed in on a section where water sinks from the surface to the bottom of the North Atlantic. They confirmed that the AMOC started weakening about 400 years before a major cold snap 13,000 years ago, and began strengthening again about 400 years before an abrupt warming 11,000 years ago.
“Our reconstructions indicate that there are clear climate precursors provided by the ocean state — like warning signs, so to speak,” says lead author Francesco Muschitiello, who completed the work as a postdoc at Lamont-Doherty and now works at the University of Cambridge.
Core Truths
Until now, it has been difficult to resolve whether past changes in the ocean conveyor belt occurred before or after the abrupt climate shifts that punctuated the last deglaciation in the Northern Hemisphere. To overcome the usual challenges, the team pieced together data from a sediment core drilled from the bottom of the Norwegian Sea, a lake sediment core from southern Scandinavia, and ice cores from Greenland.
Scientists typically rely on radioactive carbon (carbon 14) dating to determine the ages of sediments; measuring how much carbon 14 remains in a fossil reveals how long ago the organism died, and thus how old the surrounding sediment is. This relationship is tricky in ocean sediments, though, because carbon 14 is created in the atmosphere, and it takes time for the carbon to make its way through the ocean. By the time it reaches the organisms at the bottom of the water column, the carbon 14 could already be hundreds or thousands of years old. So the team needed a different way to date the sediment layers in the marine core.
That’s why they measured carbon 14 content in a nearby lake sediment core. The ancient layers of the lake contain decaying plants that pulled carbon 14 directly out of the atmosphere, so the scientists could find out the age of each lake sediment layer. Then they used a few techniques to match the lake sediment core layers to the marine core layers. Ash layers from two long-ago volcanic eruptions in Iceland helped to line things up. This process gave the team the precise age of each layer in the marine core.
Next, they compared the real age of the marine sediments to the age they were reading from the deep ocean carbon 14 measurements; the differences between these two gave them an estimate of how long it took for the atmospheric carbon 14 to reach the seafloor. In other words, it revealed how quickly water was sinking in this area, in a process called deep water formation that’s essential to keeping the AMOC circulating. Now they had a record of ocean circulation patterns in this region over time.
The final piece of the puzzle was to analyze ice cores from Greenland, to study changes in temperature and climate over the same time period. Measurements of beryllium-10 in the ice cores helped the authors precisely link the ice cores to the carbon 14 records, putting both sets of data on the same timeline. Now they could finally compare the order of events between ocean circulation changes and climatic shifts.
Leads and Lags
Comparing the data from the three cores revealed that the AMOC weakened in the time leading up to the planet’s last major cold snap, called the Younger Dryas, around 13,000 years ago. The ocean circulation began slowing down about 400 years before the cold snap, but once the climate started changing, temperatures over Greenland plunged quickly by about 6 degrees.

The study finds that changes in AMOC strength (blue line) began hundreds of years before the sharp and abrupt temperature changes over Greenland (red line) that mark the beginning and end of the hemispheric cold snap known as the Younger Dryas period (shown here as a gray column). Image: Muschitiello et al.
A similar pattern emerged near the end of that cold snap; the current started strengthening roughly 400 years before the atmosphere began to heat up dramatically, transitioning out of the ice age. Once the deglaciation started, Greenland warmed up rapidly — its average temperature climbed by about 8 degrees over just a few decades, causing glaciers to melt and sea ice to drop off considerably in the North Atlantic.
“Those [400-year] lags are probably on the long side of what many would have expected,” says Anders Svensson, who studies the paleoclimate at the University of Copenhagen, and who was not involved with the current study. “Many previous studies have suggested time lags of various lengths, but few have had the necessary tools to determine the phasing with sufficient accuracy.”
Co-author William D’Andrea, a paleoclimatologist at Lamont-Doherty was surprised by what they found — he says the lag times are two or three times greater than he would have expected.
Future AMOC
For now it’s not fully clear why there was such a long delay between the AMOC changes and climatic changes over the North Atlantic.
It’s also difficult to pinpoint what these patterns from the past could signify for Earth’s future. Recent evidence suggests that the AMOC began weakening again 150 years ago. However, current conditions are quite different from the last time around, says Muschitiello; the global thermostat was much lower back then, winter sea ice stretched farther south than New York Harbor, and the ocean structure would have been much different. In addition, the past weakening of the AMOC was much more dramatic than today’s trend so far.
Nevertheless, D’Andrea says that “if the AMOC were to weaken to the degree it did back then, it could take hundreds of years for major climate changes to actually manifest.”
Muschitiello adds, “It is clear that there are some precursors in the ocean, so we should be watching the ocean. The mere fact that AMOC has been slowing down, that should be a concern based on what we have found.”
The study should also help to improve the physics behind climate models, which generally assume the climate responds abruptly at the same time as AMOC intensity changes. The model refinements, in turn, could make climate predictions more accurate. As Svensson puts it: “As long as we do not understand the climate of the past, it is very difficult to constrain the climate models needed to make realistic future scenarios.”
https://blogs.ei.columbia.edu/2019/03/20/amoc-ocean-conveyor-belt-climate-change/
Changes in Ocean ‘Conveyor Belt’ Foretold Abrupt Climate Changes by Four Centuries
Same Atlantic Current Is Weakening Today
by Sarah Fecht|March 20, 2019
In the Atlantic Ocean, a giant ‘conveyor belt’ carries warm waters from the tropics into the North Atlantic, where they cool and sink and then return southwards in the deep ocean. This circulation pattern is an important player in the global climate, regulating weather patterns in the Arctic, Europe, and around the world. Evidence increasingly suggests that this system is slowing down, and some scientists fear it could have major effects, such as causing temperatures to dive in Europe and warming the waters off the East coast of the United States, potentially harming fisheries and exacerbating hurricanes.
A simplified diagram of the Atlantic Meridional Overturning Circulation. This ‘conveyor belt’ carries warm water from the tropics (represented by red arrows) into the North Atlantic. There, the water cools and sinks before flowing back toward the south (yellow arrows). This pattern of circulation plays an important role in regulating climate in the North Atlantic as well as the rest of the world. Image: Muschitiello et al.
A new study published in Nature Communications provides insight into how quickly these changes could take effect if the system continues weakening. Led by scientists at Columbia’s Lamont-Doherty Earth Observatory in collaboration with the Norwegian Research Centre, the study is the first to precisely determine the time lags between past changes to the ocean conveyor belt and major climate changes.
The team studied a key section of the ocean current pattern, known as the Atlantic Meridional Overturning Circulation (AMOC). They zeroed in on a section where water sinks from the surface to the bottom of the North Atlantic. They confirmed that the AMOC started weakening about 400 years before a major cold snap 13,000 years ago, and began strengthening again about 400 years before an abrupt warming 11,000 years ago.
“Our reconstructions indicate that there are clear climate precursors provided by the ocean state — like warning signs, so to speak,” says lead author Francesco Muschitiello, who completed the work as a postdoc at Lamont-Doherty and now works at the University of Cambridge.
Core Truths
Until now, it has been difficult to resolve whether past changes in the ocean conveyor belt occurred before or after the abrupt climate shifts that punctuated the last deglaciation in the Northern Hemisphere. To overcome the usual challenges, the team pieced together data from a sediment core drilled from the bottom of the Norwegian Sea, a lake sediment core from southern Scandinavia, and ice cores from Greenland.
Scientists typically rely on radioactive carbon (carbon 14) dating to determine the ages of sediments; measuring how much carbon 14 remains in a fossil reveals how long ago the organism died, and thus how old the surrounding sediment is. This relationship is tricky in ocean sediments, though, because carbon 14 is created in the atmosphere, and it takes time for the carbon to make its way through the ocean. By the time it reaches the organisms at the bottom of the water column, the carbon 14 could already be hundreds or thousands of years old. So the team needed a different way to date the sediment layers in the marine core.
That’s why they measured carbon 14 content in a nearby lake sediment core. The ancient layers of the lake contain decaying plants that pulled carbon 14 directly out of the atmosphere, so the scientists could find out the age of each lake sediment layer. Then they used a few techniques to match the lake sediment core layers to the marine core layers. Ash layers from two long-ago volcanic eruptions in Iceland helped to line things up. This process gave the team the precise age of each layer in the marine core.
Next, they compared the real age of the marine sediments to the age they were reading from the deep ocean carbon 14 measurements; the differences between these two gave them an estimate of how long it took for the atmospheric carbon 14 to reach the seafloor. In other words, it revealed how quickly water was sinking in this area, in a process called deep water formation that’s essential to keeping the AMOC circulating. Now they had a record of ocean circulation patterns in this region over time.
The final piece of the puzzle was to analyze ice cores from Greenland, to study changes in temperature and climate over the same time period. Measurements of beryllium-10 in the ice cores helped the authors precisely link the ice cores to the carbon 14 records, putting both sets of data on the same timeline. Now they could finally compare the order of events between ocean circulation changes and climatic shifts.
Leads and Lags
Comparing the data from the three cores revealed that the AMOC weakened in the time leading up to the planet’s last major cold snap, called the Younger Dryas, around 13,000 years ago. The ocean circulation began slowing down about 400 years before the cold snap, but once the climate started changing, temperatures over Greenland plunged quickly by about 6 degrees.
The study finds that changes in AMOC strength (blue line) began hundreds of years before the sharp and abrupt temperature changes over Greenland (red line) that mark the beginning and end of the hemispheric cold snap known as the Younger Dryas period (shown here as a gray column). Image: Muschitiello et al.
A similar pattern emerged near the end of that cold snap; the current started strengthening roughly 400 years before the atmosphere began to heat up dramatically, transitioning out of the ice age. Once the deglaciation started, Greenland warmed up rapidly — its average temperature climbed by about 8 degrees over just a few decades, causing glaciers to melt and sea ice to drop off considerably in the North Atlantic.
“Those [400-year] lags are probably on the long side of what many would have expected,” says Anders Svensson, who studies the paleoclimate at the University of Copenhagen, and who was not involved with the current study. “Many previous studies have suggested time lags of various lengths, but few have had the necessary tools to determine the phasing with sufficient accuracy.”
Co-author William D’Andrea, a paleoclimatologist at Lamont-Doherty was surprised by what they found — he says the lag times are two or three times greater than he would have expected.
Future AMOC
For now it’s not fully clear why there was such a long delay between the AMOC changes and climatic changes over the North Atlantic.
It’s also difficult to pinpoint what these patterns from the past could signify for Earth’s future. Recent evidence suggests that the AMOC began weakening again 150 years ago. However, current conditions are quite different from the last time around, says Muschitiello; the global thermostat was much lower back then, winter sea ice stretched farther south than New York Harbor, and the ocean structure would have been much different. In addition, the past weakening of the AMOC was much more dramatic than today’s trend so far.
Nevertheless, D’Andrea says that “if the AMOC were to weaken to the degree it did back then, it could take hundreds of years for major climate changes to actually manifest.”
Muschitiello adds, “It is clear that there are some precursors in the ocean, so we should be watching the ocean. The mere fact that AMOC has been slowing down, that should be a concern based on what we have found.”
The study should also help to improve the physics behind climate models, which generally assume the climate responds abruptly at the same time as AMOC intensity changes. The model refinements, in turn, could make climate predictions more accurate. As Svensson puts it: “As long as we do not understand the climate of the past, it is very difficult to constrain the climate models needed to make realistic future scenarios.”
https://blogs.ei.columbia.edu/2019/03/20/amoc-ocean-conveyor-belt-climate-change/
Slow-Motion Ocean: Atlantic’s Circulation Is Weakest in 1,600 Years
If hemisphere-spanning currents are slowing, greater flooding and extreme weather could be at hand

Credit: Tim Graham Getty Images In recent years sensors stationed across the North Atlantic have picked up a potentially concerning signal: The grand northward progression of water along North America that moves heat from the tropics toward the Arctic has been sluggish. If that languidness continues and deepens, it could usher in drastic changes in sea level and weather around the ocean basin.
That northward flow is a key part of the larger circulation of water, heat and nutrients around the world’s oceans. Climate scientists have been concerned since the 1980s that rising global temperatures could throw a wrench in the conveyor belt–like system, with possibly stark climatic consequences. Sea levels could ratchet upward along the U.S. east coast, key fisheries could be devastated by spiking water temperatures and weather patterns over Europe could be altered.
Such concerns had been quelled over the last decade as climate models suggested this branch of the ocean’s circulatory system was not likely to see a rapid slowdown, which would slow any consequences. But two new studies, published Wednesday in the journal Nature, suggest the recent weakening spotted by ocean sensors is not just a short-term blip, as some had thought. Rather, it is part of a longer-term decline that has put the circulation at its weakest state in centuries. The results imply climate models are missing key pieces of the puzzle, and that ill effects could be on their way.
Advertisement Which pieces might be missing, though, could determine how worrying this trend is. If models are not sensitive enough to the changes going on in the North Atlantic, “that sort of puts the warning flag a little higher,” says Thomas Delworth, an ocean and climate modeler at the National Oceanic and Atmospheric Administration who was not involved in the research.
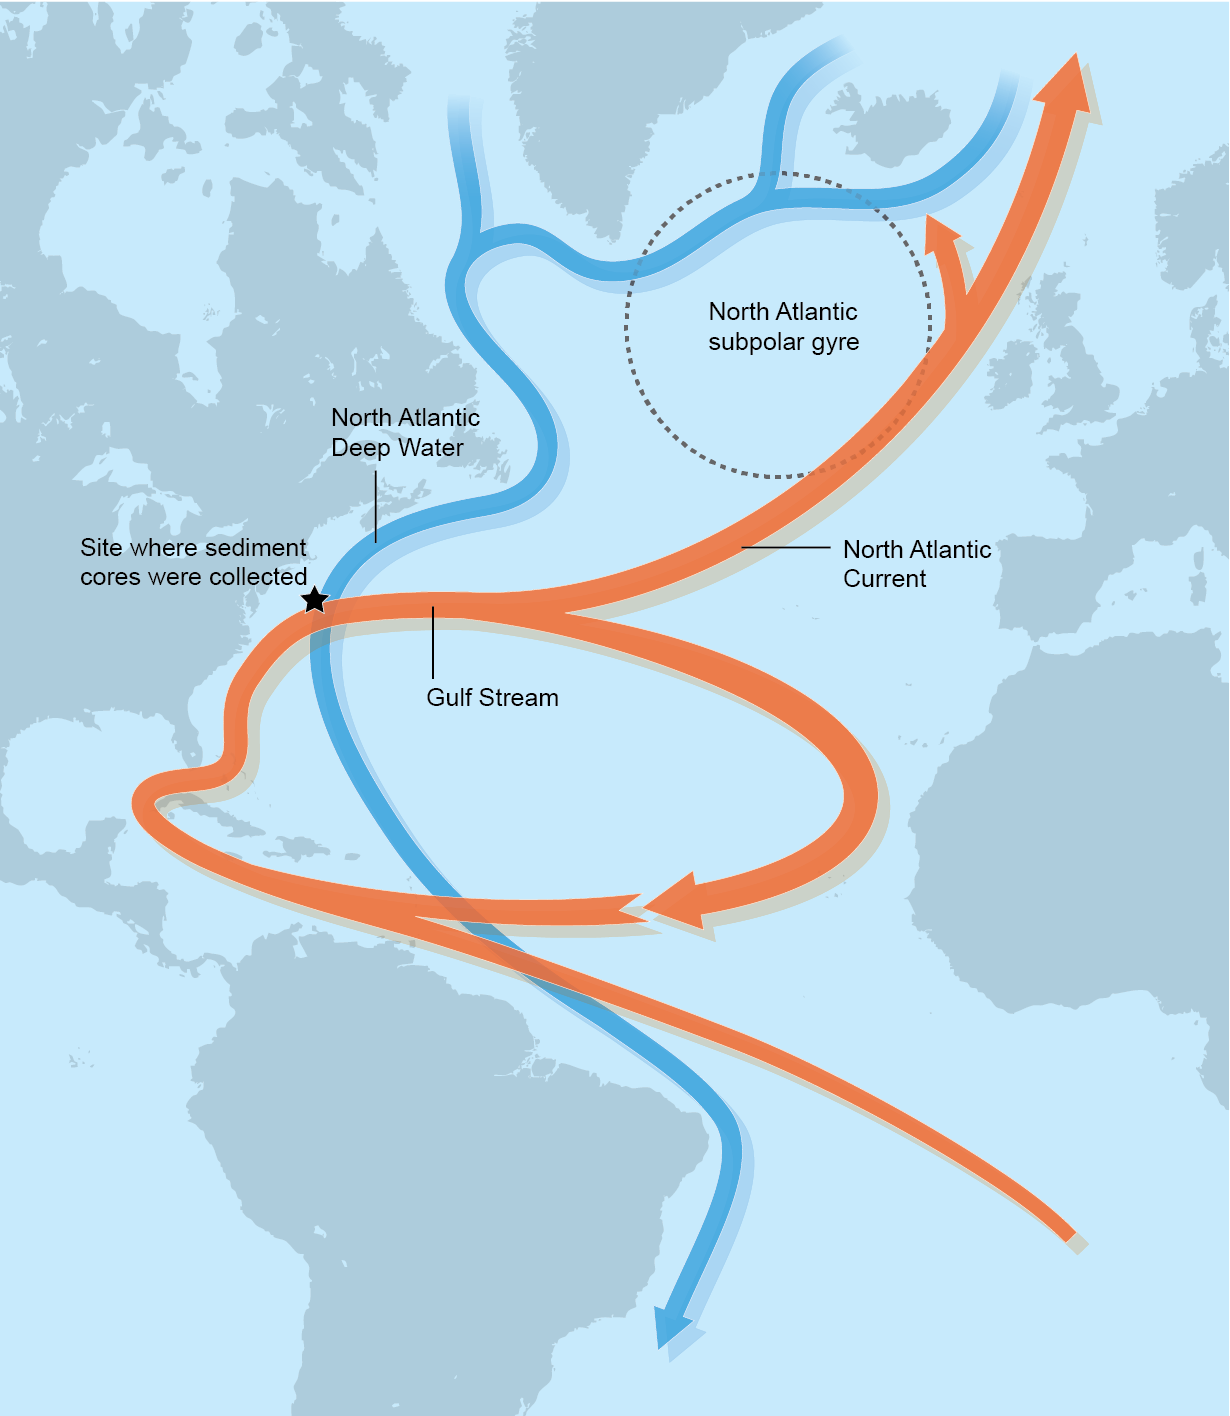
The Atlantic meridional overturning circulation (AMOC) and the subpolar gyre, where ocean waters cool when the AMOC weakens. Credit: Nature Running AMOC
The warm, salty waters of the tropical Atlantic cruise northward along the eastern U.S. before darting toward northwestern Europe (giving the British Isles a climate far balmier than Newfoundland at a similar latitude). As that segment of ocean flow, known as the Gulf Stream, pushes north, it cools and becomes denser and eventually sinks, forming the so-called deepwater that flows back southward along the ocean floor toward Antarctica.
This cycle, called the Atlantic Meridional Overturning Circulation (AMOC), plays a key role in moving heat around the planet as well as nutrients throughout the ocean. It also helps draw carbon dioxide from the atmosphere into the sea. In the Pacific Ocean equatorial heat is transported north and south toward both poles. But in the Atlantic “the heat is moving northward throughout the whole Atlantic Ocean,” says David Thornalley, a paleo-oceanographer at University College London and co-author of one of the new studies. The resulting heat imbalance between the Northern and Southern hemispheres determines several large climatic features, such as the latitude at which a key tropical rain belt is located, which impacts water supplies, precipitation for agriculture and the health of tropical ecosystems.
As global temperatures rise with the levels of heat-trapping gases in the atmosphere, the AMOC could be disrupted by an influx of freshwater from increasing precipitation in the North Atlantic and the melting of sea ice and glaciers on land. The added freshwater lowers the water density in the zone where deepwater forms, backing up and weakening the overall flow of the AMOC like a clogged sink. That slowdown means less heat is transported northward, leading to cooler ocean temperatures in a region below Greenland, and warmer temperatures off the U.S. east coast. That warming leads to higher sea levels along the coast and raises sea temperatures where economically valuable cold-loving species like cod and lobster live.
There are some indications the cold spot below Greenland can alter atmospheric patterns in a way that channels warm air over Europe, increasing the likelihood of sustained summer heat waves, says Levke Caesar, a PhD student at the Potsdam Institute for Climate Impact Research (PIK) and co-author of the other new study. The changing ocean temperatures from an AMOC slowdown could also potentially help lock in colder winter conditions over the eastern U.S., PIK’s Stefan Rahmstorf, a co-author of the same research, has posited, although the evidence there is not clear.
Advertisement Until a little more than 10 years ago scientists did not have any direct measurements of the AMOC to see how it was actually responding to climate change. The deployment of the RAPID array of instruments (short for the U.K and U.S.–sponsored Rapid Climate Change program) across the Atlantic Basin has allowed that data to slowly trickle in, and “they’ve been revealing it is undergoing weakening,” Thornalley says. But the brief window of data offers no longer-term perspective. When that first data came in, scientists thought the weakening could be a temporary change resulting from the natural ups and downs of the climate, but were aware it could be part of a much longer decline.
Clues from the Past
To help resolve the uncertainty, the teams involved with the new studies turned to what are called paleoclimate markers, which capture past changes in Earth’s climate to see how these recent changes fit in. Thornalley and his colleagues used sediment cores collected from the ocean floor along the U.S. east coast to reveal how deep ocean currents linked to the AMOC have changed over time; stronger currents deposit larger grains of sediment. They also looked at tiny creatures fossilized in sediment cores—some of which had thrived in colder conditions, others in warmer ones—to see how ocean temperatures changed as the AMOC waxed and waned in strength. Caesar and Rahmstorf’s study used direct measurements of ocean temperatures going back to the late 19th century.
The two studies came to broadly similar conclusions: The AMOC is in a very weakened state—the most anemic it has been in the last 1,600 years, according to Thornalley’s results.

Sign up for Scientific American’s free newsletters.
The studies differ on the timing of when that weakening began. Thornalley’s record, which spans those 1,600 years, suggests it started at the end of the little ice age, a period from about A.D. 1350 to 1850, when solar and volcanic influences depressed temperatures across the Northern Hemisphere and glaciers and ice sheets expanded. As the little ice age ended and temperatures warmed, ice melted and freshwater flooded into the North Atlantic. The results suggest the current state of the AMOC is the weakest it has been over that whole long record. Whether today’s state is just a continuation of that reaction or whether global warming has also started to chip in is not clear, he says. Caesar, meanwhile, put the turning point toward a weaker AMOC in the mid-20th century, suggesting it is due to the influence of human-caused warming. Her team’s record, however, does not extend as far back.
The two results are not mutually exclusive. Both records show broadly similar patterns in decline. “We think it’s quite remarkable that all the evidence is converging,” Thornalley says. But pinpointing the timing of the weakening trend would give better clues as to what is driving it as well as how quickly it is happening and how rapidly we might expect to see some of the resulting climate impacts.
Advertisement Already, Thornalley says, it is clear the Gulf of Maine has its warmest temperatures in the last 1,600 years. There are also “tantalizing glimpses” of more rapid sea level rise along the U.S., he says.
The researchers are curious why climate models seem to be missing something in the AMOC process. They do not capture this past behavior and significant weakening. If the results of these studies bear out, Delworth says, it is possible the models are not sensitive enough to the changes in ocean freshwater that are happening or they are not factoring in all of the important changes that have impacted the circulation. A 2017 study that looked at what would happen if climate models did factor in that melt saw it caused a sharper response from the AMOC than had otherwise been suggested.
The greater cause for concern would be if models are incorrectly capturing the sensitivity of the system, Delworth says, because it means scientist have been underestimating how quickly the AMOC might respond. “It really depends on why the models don’t match the paleo results,” he says.
While modelers work to figure that out, Thornalley and others are trying to expand the paleoclimate record to see if the pattern they found shows up at other sites throughout the Atlantic and if they can extend it farther back in time. They are also looking for signs of how much freshwater may have triggered the weakening at the end of the little ice age.
Moving forward, the RAPID instruments will slowly help tease out the AMOC’s behavior. “It’s just that we have to wait a couple of years,” Caesar says, by which time some impacts may already be happening.
https://www.scientificamerican.com/...antics-circulation-is-weakest-in-1-600-years/
[youtubeif]uxg0OEwzEcE[/youtubeif]
https://www.youtube.com/watch?v=uxg0OEwzEcE
 NASA Scientific Visualization Studio
Published on Mar 25, 2019
This visualization shows a variety of data from the oceans and ice to help explain why Jakobshavn glacier grew thicker and advanced between 2016 and 2017. Initially, the average flow of ice across the Greenland Ice Sheet in these years is shown as colored flow arrows, with blue shades indicating slower movement and red indicating faster. As we draw near we see a large bay named Disko Bay located just to the west of the narrow inlet, or fjord, that is home to Jakobshavn glacier. The water is cut away to reveal the historical temperature of the bay, to a depth of about 400 meters. Around Greenland, water below 150 m depth tends to be warmer than water near the surface. The change in temperature between 1952 and 2017 is shown using blue tones for colder water and red tones for warmer. The deep water warms through most of the 1990s, but cools dramatically after 2015. The ocean temperature changes are shown a second time, with a brief pause on 1979 to see the initial cooler water temperature, 2000 to view the warming and 2017 to view the current cooling trend. Jakobshavn Glacier is Greenland's largest and fastest moving glacier. Over the last 20 years, it has retreated, sped up and thinned. The data shown here reveal that Jakobshavn’s retreat has reversed. Between 2016 and 2018, the glacier advanced and got thicker. Scientists from NASA’s Jet Propulsion Laboratory have linked these changes to cooling of the ocean waters that reach Jakobshavn after traveling around the southern tip of Greenland and reaching into Disko Bay (**Link to publication here**). The ocean cooling was likely related to the natural cycles of warming and cooling that happen in the Atlantic as part of the North Atlantic Oscillation. The strong influence of the ocean on the ice loss from Jakboshavn is somewhat surprising because the role of the ocean has been unclear since the glacier’s floating extension, called an ice tongue, disintegrated in 2003. These results mean that future projections of sea level rise will need to account for the ocean changes in order to accurately predict how fast Greenland’s ice will melt in a warming climate. The visualization pulls out to show the entire Greenland Ice Sheet while ocean is drained to reveal the shape and depth of the ocean floor around the ice sheet. Data from the ECCO ocean circulation model shows ocean currents carrying water around the southern tip of Greenland and up the west coast, where it eventually enters Disko Bay and reaches Jakboshavn glacier. When we zoom in to the Jakobshavn glacier again, we see the glacier is blanketed by more than 40, 000 radar observations. These data show the change in elevation between 2016 and 2017 as measured by an aircraft. These elevation changes are colored so that blue colors indicate an rise in the elevation and orange/red colors indicate a fall. The deepest blue color reflects the advance of the glacier from the 2016 front, appearing in the video as a shaded cliff, to its more advanced location in 2017. Farther downstream in the fjord the patches of blue and red show icebergs, which have detached from the front. Visualizers: Cindy Starr (lead), Horace Mitchell, Greg Shirah For more information or to download this public domain video, go to https://svs.gsfc.nasa.gov/4688#26988
still waiting...
If hemisphere-spanning currents are slowing, greater flooding and extreme weather could be at hand
- By Andrea Thompson on April 11, 2018
Credit: Tim Graham Getty Images In recent years sensors stationed across the North Atlantic have picked up a potentially concerning signal: The grand northward progression of water along North America that moves heat from the tropics toward the Arctic has been sluggish. If that languidness continues and deepens, it could usher in drastic changes in sea level and weather around the ocean basin.
That northward flow is a key part of the larger circulation of water, heat and nutrients around the world’s oceans. Climate scientists have been concerned since the 1980s that rising global temperatures could throw a wrench in the conveyor belt–like system, with possibly stark climatic consequences. Sea levels could ratchet upward along the U.S. east coast, key fisheries could be devastated by spiking water temperatures and weather patterns over Europe could be altered.
Such concerns had been quelled over the last decade as climate models suggested this branch of the ocean’s circulatory system was not likely to see a rapid slowdown, which would slow any consequences. But two new studies, published Wednesday in the journal Nature, suggest the recent weakening spotted by ocean sensors is not just a short-term blip, as some had thought. Rather, it is part of a longer-term decline that has put the circulation at its weakest state in centuries. The results imply climate models are missing key pieces of the puzzle, and that ill effects could be on their way.
Advertisement Which pieces might be missing, though, could determine how worrying this trend is. If models are not sensitive enough to the changes going on in the North Atlantic, “that sort of puts the warning flag a little higher,” says Thomas Delworth, an ocean and climate modeler at the National Oceanic and Atmospheric Administration who was not involved in the research.
The Atlantic meridional overturning circulation (AMOC) and the subpolar gyre, where ocean waters cool when the AMOC weakens. Credit: Nature Running AMOC
The warm, salty waters of the tropical Atlantic cruise northward along the eastern U.S. before darting toward northwestern Europe (giving the British Isles a climate far balmier than Newfoundland at a similar latitude). As that segment of ocean flow, known as the Gulf Stream, pushes north, it cools and becomes denser and eventually sinks, forming the so-called deepwater that flows back southward along the ocean floor toward Antarctica.
This cycle, called the Atlantic Meridional Overturning Circulation (AMOC), plays a key role in moving heat around the planet as well as nutrients throughout the ocean. It also helps draw carbon dioxide from the atmosphere into the sea. In the Pacific Ocean equatorial heat is transported north and south toward both poles. But in the Atlantic “the heat is moving northward throughout the whole Atlantic Ocean,” says David Thornalley, a paleo-oceanographer at University College London and co-author of one of the new studies. The resulting heat imbalance between the Northern and Southern hemispheres determines several large climatic features, such as the latitude at which a key tropical rain belt is located, which impacts water supplies, precipitation for agriculture and the health of tropical ecosystems.
As global temperatures rise with the levels of heat-trapping gases in the atmosphere, the AMOC could be disrupted by an influx of freshwater from increasing precipitation in the North Atlantic and the melting of sea ice and glaciers on land. The added freshwater lowers the water density in the zone where deepwater forms, backing up and weakening the overall flow of the AMOC like a clogged sink. That slowdown means less heat is transported northward, leading to cooler ocean temperatures in a region below Greenland, and warmer temperatures off the U.S. east coast. That warming leads to higher sea levels along the coast and raises sea temperatures where economically valuable cold-loving species like cod and lobster live.
There are some indications the cold spot below Greenland can alter atmospheric patterns in a way that channels warm air over Europe, increasing the likelihood of sustained summer heat waves, says Levke Caesar, a PhD student at the Potsdam Institute for Climate Impact Research (PIK) and co-author of the other new study. The changing ocean temperatures from an AMOC slowdown could also potentially help lock in colder winter conditions over the eastern U.S., PIK’s Stefan Rahmstorf, a co-author of the same research, has posited, although the evidence there is not clear.
Advertisement Until a little more than 10 years ago scientists did not have any direct measurements of the AMOC to see how it was actually responding to climate change. The deployment of the RAPID array of instruments (short for the U.K and U.S.–sponsored Rapid Climate Change program) across the Atlantic Basin has allowed that data to slowly trickle in, and “they’ve been revealing it is undergoing weakening,” Thornalley says. But the brief window of data offers no longer-term perspective. When that first data came in, scientists thought the weakening could be a temporary change resulting from the natural ups and downs of the climate, but were aware it could be part of a much longer decline.
Clues from the Past
To help resolve the uncertainty, the teams involved with the new studies turned to what are called paleoclimate markers, which capture past changes in Earth’s climate to see how these recent changes fit in. Thornalley and his colleagues used sediment cores collected from the ocean floor along the U.S. east coast to reveal how deep ocean currents linked to the AMOC have changed over time; stronger currents deposit larger grains of sediment. They also looked at tiny creatures fossilized in sediment cores—some of which had thrived in colder conditions, others in warmer ones—to see how ocean temperatures changed as the AMOC waxed and waned in strength. Caesar and Rahmstorf’s study used direct measurements of ocean temperatures going back to the late 19th century.
The two studies came to broadly similar conclusions: The AMOC is in a very weakened state—the most anemic it has been in the last 1,600 years, according to Thornalley’s results.
Sign up for Scientific American’s free newsletters.
The studies differ on the timing of when that weakening began. Thornalley’s record, which spans those 1,600 years, suggests it started at the end of the little ice age, a period from about A.D. 1350 to 1850, when solar and volcanic influences depressed temperatures across the Northern Hemisphere and glaciers and ice sheets expanded. As the little ice age ended and temperatures warmed, ice melted and freshwater flooded into the North Atlantic. The results suggest the current state of the AMOC is the weakest it has been over that whole long record. Whether today’s state is just a continuation of that reaction or whether global warming has also started to chip in is not clear, he says. Caesar, meanwhile, put the turning point toward a weaker AMOC in the mid-20th century, suggesting it is due to the influence of human-caused warming. Her team’s record, however, does not extend as far back.
The two results are not mutually exclusive. Both records show broadly similar patterns in decline. “We think it’s quite remarkable that all the evidence is converging,” Thornalley says. But pinpointing the timing of the weakening trend would give better clues as to what is driving it as well as how quickly it is happening and how rapidly we might expect to see some of the resulting climate impacts.
Advertisement Already, Thornalley says, it is clear the Gulf of Maine has its warmest temperatures in the last 1,600 years. There are also “tantalizing glimpses” of more rapid sea level rise along the U.S., he says.
The researchers are curious why climate models seem to be missing something in the AMOC process. They do not capture this past behavior and significant weakening. If the results of these studies bear out, Delworth says, it is possible the models are not sensitive enough to the changes in ocean freshwater that are happening or they are not factoring in all of the important changes that have impacted the circulation. A 2017 study that looked at what would happen if climate models did factor in that melt saw it caused a sharper response from the AMOC than had otherwise been suggested.
The greater cause for concern would be if models are incorrectly capturing the sensitivity of the system, Delworth says, because it means scientist have been underestimating how quickly the AMOC might respond. “It really depends on why the models don’t match the paleo results,” he says.
While modelers work to figure that out, Thornalley and others are trying to expand the paleoclimate record to see if the pattern they found shows up at other sites throughout the Atlantic and if they can extend it farther back in time. They are also looking for signs of how much freshwater may have triggered the weakening at the end of the little ice age.
Moving forward, the RAPID instruments will slowly help tease out the AMOC’s behavior. “It’s just that we have to wait a couple of years,” Caesar says, by which time some impacts may already be happening.
https://www.scientificamerican.com/...antics-circulation-is-weakest-in-1-600-years/
[youtubeif]uxg0OEwzEcE[/youtubeif]
https://www.youtube.com/watch?v=uxg0OEwzEcE
NASA Scientific Visualization Studio Published on Mar 25, 2019
This visualization shows a variety of data from the oceans and ice to help explain why Jakobshavn glacier grew thicker and advanced between 2016 and 2017. Initially, the average flow of ice across the Greenland Ice Sheet in these years is shown as colored flow arrows, with blue shades indicating slower movement and red indicating faster. As we draw near we see a large bay named Disko Bay located just to the west of the narrow inlet, or fjord, that is home to Jakobshavn glacier. The water is cut away to reveal the historical temperature of the bay, to a depth of about 400 meters. Around Greenland, water below 150 m depth tends to be warmer than water near the surface. The change in temperature between 1952 and 2017 is shown using blue tones for colder water and red tones for warmer. The deep water warms through most of the 1990s, but cools dramatically after 2015. The ocean temperature changes are shown a second time, with a brief pause on 1979 to see the initial cooler water temperature, 2000 to view the warming and 2017 to view the current cooling trend. Jakobshavn Glacier is Greenland's largest and fastest moving glacier. Over the last 20 years, it has retreated, sped up and thinned. The data shown here reveal that Jakobshavn’s retreat has reversed. Between 2016 and 2018, the glacier advanced and got thicker. Scientists from NASA’s Jet Propulsion Laboratory have linked these changes to cooling of the ocean waters that reach Jakobshavn after traveling around the southern tip of Greenland and reaching into Disko Bay (**Link to publication here**). The ocean cooling was likely related to the natural cycles of warming and cooling that happen in the Atlantic as part of the North Atlantic Oscillation. The strong influence of the ocean on the ice loss from Jakboshavn is somewhat surprising because the role of the ocean has been unclear since the glacier’s floating extension, called an ice tongue, disintegrated in 2003. These results mean that future projections of sea level rise will need to account for the ocean changes in order to accurately predict how fast Greenland’s ice will melt in a warming climate. The visualization pulls out to show the entire Greenland Ice Sheet while ocean is drained to reveal the shape and depth of the ocean floor around the ice sheet. Data from the ECCO ocean circulation model shows ocean currents carrying water around the southern tip of Greenland and up the west coast, where it eventually enters Disko Bay and reaches Jakboshavn glacier. When we zoom in to the Jakobshavn glacier again, we see the glacier is blanketed by more than 40, 000 radar observations. These data show the change in elevation between 2016 and 2017 as measured by an aircraft. These elevation changes are colored so that blue colors indicate an rise in the elevation and orange/red colors indicate a fall. The deepest blue color reflects the advance of the glacier from the 2016 front, appearing in the video as a shaded cliff, to its more advanced location in 2017. Farther downstream in the fjord the patches of blue and red show icebergs, which have detached from the front. Visualizers: Cindy Starr (lead), Horace Mitchell, Greg Shirah For more information or to download this public domain video, go to https://svs.gsfc.nasa.gov/4688#26988
still waiting...
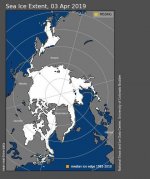
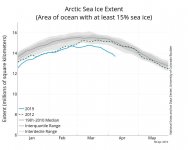
back to original topic, what is going on at the top of the world?
maximum reached in mid March, but was very close to being in February
melt season is going big, ice levels are now at record lows
big losses in the Bering sea the chief culprit
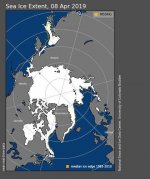
maximum reached in mid March, but was very close to being in February
melt season is going big, ice levels are now at record lows
big losses in the Bering sea the chief culprit
Attachments

really?
by what mechanism is that ice melting?
still below freezing there...
https://www.yr.no/place/North_Pole/Other/North_Pole/
Time / Forecast /Temp. /Precipitation /Wind
21:00 Partly cloudy. -18° 0 mm Light air, 1 m/s from north- northeast

by what mechanism is that ice melting?
still below freezing there...
https://www.yr.no/place/North_Pole/Other/North_Pole/
Time / Forecast /Temp. /Precipitation /Wind
21:00 Partly cloudy. -18° 0 mm Light air, 1 m/s from north- northeast

really?
by what mechanism is that ice melting?
https://www.icmag.com/ic/picture.php?albumid=18957&pictureid=1935146View Image
still below freezing there...
https://www.yr.no/place/North_Pole/Other/North_Pole/
Time / Forecast /Temp. /Precipitation /Wind
21:00 Partly cloudy. -18° 0 mm Light air, 1 m/s from north- northeast
View Image
there's a lot of variation in the region
the temperature you're providing is coming from the north pole proper?
that's how i understood it
and ice can melt from warm water currents
do you disbelieve the nsidc maps? you're free to, just looking for clear answers
back again, normally i just post the big events in the arctic season
the minimum, the maximum, and other notable happenings
well, things are getting notable up in the north
a very strong start to the melt season, not likely a good thing
and those that have noticed the cold crap we've been getting in the northern USA
it's not coincidence, the arctic cold has been pushed all over during the winter
which in turns brings warmer air to the north
i'd stay tuned for further happenings, because it looks like there are going to be plenty of them
Attachments
that was North Pole, Alaska
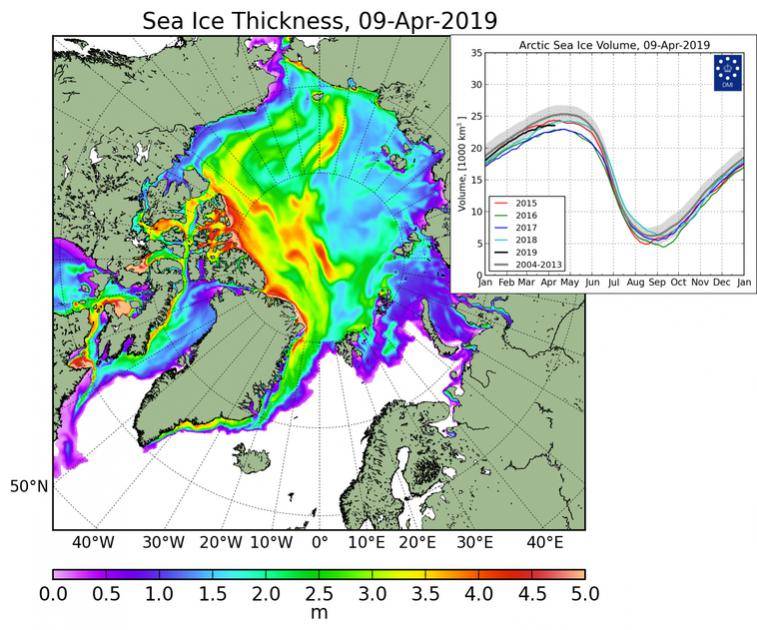
doesn't appear to follow the script, what with all that 3-5 Meter thick ice...
and if every year seems to be hotter than the last why isn't the ice disappearing faster this season than 2017?
On thin ice
Scientists predict that ships will be able to sail directly over the North Pole by the year 2050. In fact, the Arctic ice sheet will be thin enough for ice breakers to carve a straight path between the Pacific and Atlantic oceans, according to a study by researchers at the University of California, Los Angeles (UCLA). Another study found that by the end of the 21st century, the Northern Sea Route could be navigable for more than half the year.
lol
In particular, the Arctic has experienced major ice decline within the last decade. So what is happening? Typically, the ice follows a seasonal cycle. For example, in the spring and summer months, the warmer temperatures cause the ice floating on top of the Arctic Ocean to shrink. Then as the temperatures drop in the fall and winter months, the ice cover grows again until it reaches its yearly maximum extent, typically in March.
In 2017, however, a combination of warmer-than-average temperatures, winds unfavorable to ice expansion, and a series of storms halted sea ice growth in the Arctic. In fact,on March 7, 2017, Arctic sea ice reached a new record low for wintertime maximum extent, according to NASA. Overall, the ice reached just 5.57 million square miles (14.42 million square kilometers), which is 37,000 sq mi (97,00 sq km) smaller than the previous record low set in 2015, and 471,000 sq mi (1.22 million sq km) smaller than the average maximum extent for 1981-2010.
In fact, on Feb. 13, 2017, the combined level of Arctic and Antarctic sea ice was at its lowest point since satellites began measuring polar ice in 1979. According to NASA, the total polar sea ice on this date covered only 6.26 million square miles (16.21 million square km). This number is 790,000 square miles (2 million square km) smaller than the average global minimum extent for 1981-2010. This is equivalent to losing a chunk of sea ice bigger than Mexico.
https://www.livescience.com/41955-north-pole.html
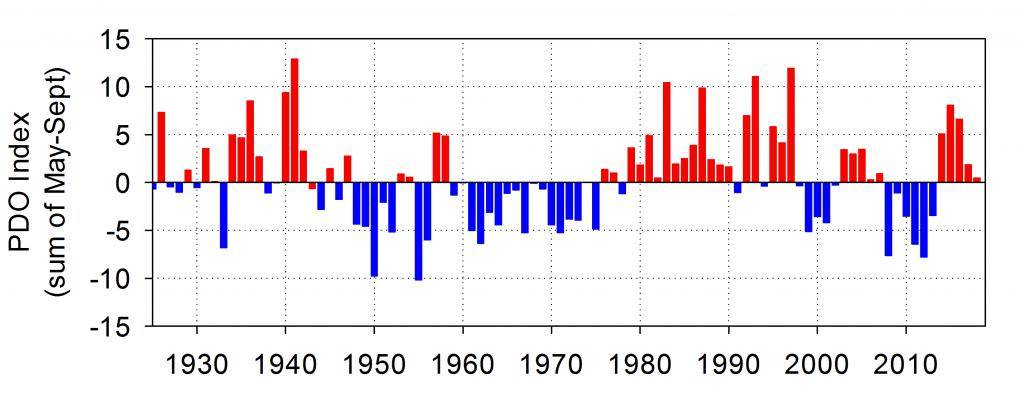
Figure PDO-01. Time series of shifts in sign of the Pacific Decadal Oscillation (PDO), 1925 to present. Values are summed over the months of May through September. Red bars indicate positive (warm) years; blue bars negative (cool) years. Note that 2008 and 2012 were the most negative values recorded since 1956.
https://www.nwfsc.noaa.gov/research/divisions/fe/estuarine/oeip/ca-pdo.cfm
[FONT=verdana,arial,serif] EL NIÑO/SOUTHERN OSCILLATION (ENSO) [/FONT] [FONT=verdana,arial,serif] DIAGNOSTIC DISCUSSION [/FONT] [FONT=verdana,arial,serif] issued by
CLIMATE PREDICTION CENTER/NCEP/NWS
and the International Research Institute for Climate and Society [/FONT] [FONT=verdana,arial,serif] [/FONT]
[FONT=verdana,arial,serif] 14 March 2019 [/FONT]
[FONT=verdana,arial] El Niño conditions strengthened during February 2019, as above-average sea surface temperatures (SSTs) increased across the equatorial Pacific Ocean [Fig. 1] and the associated atmospheric anomalies became increasingly well-defined. The SST index values in the Niño3, Niño3.4 and Niño4 regions all increased during February, with the latest weekly values near +1°C in each region [Fig. 2]. The anomalous upper-ocean heat content (averaged across 180°-100°W) increased appreciably during February [Fig. 3], due to an increase in above-average temperatures at depth in association with a downwelling equatorial oceanic Kelvin wave [Fig. 4]. Enhanced equatorial convection prevailed near the Date Line, while suppressed convection was observed over Indonesia [Fig. 5]. Low-level wind anomalies were westerly in the central Pacific Ocean, while upper-level wind anomalies were mostly westerly over the far western and far eastern Pacific. The equatorial and traditional Southern Oscillation Index values were both negative (-1.4 standard deviations). Overall, these features are consistent with weak El Niño conditions.
The majority of models in the IRI/CPC plume predict a Niño 3.4 index of +0.5°C or greater through the Northern Hemisphere early autumn 2019 [Fig. 6]. Given the recent downwelling Kelvin wave, and the increase in both the SSTs and subsurface ocean temperatures, most forecasters expect positive SST anomalies to persist across the central and eastern Pacific for at least the next several months. During that time, forecasters predict the SST anomalies in the Niño 3.4 region to remain between +0.5°C and +1.0°C, indicating weak El Niño conditions. However, because forecasts made during spring tend to be less accurate, the predicted chance that El Niño will persist beyond summer is currently about 50%. In summary, weak El Niño conditions are likely to continue through the Northern Hemisphere spring 2019 (~80% chance) and summer (~60% chance); click CPC/IRI consensus forecast for the chance of each outcome for each 3-month period.
This discussion is a consolidated effort of the National Oceanic and Atmospheric Administration (NOAA), NOAA's National Weather Service, and their funded institutions. Oceanic and atmospheric conditions are updated weekly on the Climate Prediction Center web site (El Niño/La Niña Current Conditions and Expert Discussions). Forecasts are also updated monthly in the Forecast Forum of CPCs Climate Diagnostics Bulletin. Additional perspectives and analysis are also available in an ENSO blog. The next ENSO Diagnostics Discussion is scheduled for 11 April 2019.
To receive an e-mail notification when the monthly ENSO Diagnostic Discussions are released, please send an e-mail message to: ncep.list.enso-update@noaa.gov.
[/FONT] [FONT=verdana,arial,serif] Climate Prediction Center
5830 University Research Court
College Park, Maryland 20740[/FONT]
doesn't appear to follow the script, what with all that 3-5 Meter thick ice...
and if every year seems to be hotter than the last why isn't the ice disappearing faster this season than 2017?
On thin ice
Scientists predict that ships will be able to sail directly over the North Pole by the year 2050. In fact, the Arctic ice sheet will be thin enough for ice breakers to carve a straight path between the Pacific and Atlantic oceans, according to a study by researchers at the University of California, Los Angeles (UCLA). Another study found that by the end of the 21st century, the Northern Sea Route could be navigable for more than half the year.
lol
In particular, the Arctic has experienced major ice decline within the last decade. So what is happening? Typically, the ice follows a seasonal cycle. For example, in the spring and summer months, the warmer temperatures cause the ice floating on top of the Arctic Ocean to shrink. Then as the temperatures drop in the fall and winter months, the ice cover grows again until it reaches its yearly maximum extent, typically in March.
In 2017, however, a combination of warmer-than-average temperatures, winds unfavorable to ice expansion, and a series of storms halted sea ice growth in the Arctic. In fact,on March 7, 2017, Arctic sea ice reached a new record low for wintertime maximum extent, according to NASA. Overall, the ice reached just 5.57 million square miles (14.42 million square kilometers), which is 37,000 sq mi (97,00 sq km) smaller than the previous record low set in 2015, and 471,000 sq mi (1.22 million sq km) smaller than the average maximum extent for 1981-2010.
In fact, on Feb. 13, 2017, the combined level of Arctic and Antarctic sea ice was at its lowest point since satellites began measuring polar ice in 1979. According to NASA, the total polar sea ice on this date covered only 6.26 million square miles (16.21 million square km). This number is 790,000 square miles (2 million square km) smaller than the average global minimum extent for 1981-2010. This is equivalent to losing a chunk of sea ice bigger than Mexico.
https://www.livescience.com/41955-north-pole.html
Figure PDO-01. Time series of shifts in sign of the Pacific Decadal Oscillation (PDO), 1925 to present. Values are summed over the months of May through September. Red bars indicate positive (warm) years; blue bars negative (cool) years. Note that 2008 and 2012 were the most negative values recorded since 1956.
https://www.nwfsc.noaa.gov/research/divisions/fe/estuarine/oeip/ca-pdo.cfm
[FONT=verdana,arial,serif] EL NIÑO/SOUTHERN OSCILLATION (ENSO) [/FONT] [FONT=verdana,arial,serif] DIAGNOSTIC DISCUSSION [/FONT] [FONT=verdana,arial,serif] issued by
CLIMATE PREDICTION CENTER/NCEP/NWS
and the International Research Institute for Climate and Society [/FONT] [FONT=verdana,arial,serif] [/FONT]
[FONT=verdana,arial,serif] 14 March 2019 [/FONT]
[FONT=verdana,arial,serif] ENSO Alert System Status: [/FONT] [FONT=verdana,arial,serif] El Niño Advisory [/FONT]
[FONT=verdana,arial] Synopsis: Weak El Nino conditions are likely to continue through the Northern Hemisphere spring 2019 (~80% chance) and summer (~60% chance). [/FONT][FONT=verdana,arial] El Niño conditions strengthened during February 2019, as above-average sea surface temperatures (SSTs) increased across the equatorial Pacific Ocean [Fig. 1] and the associated atmospheric anomalies became increasingly well-defined. The SST index values in the Niño3, Niño3.4 and Niño4 regions all increased during February, with the latest weekly values near +1°C in each region [Fig. 2]. The anomalous upper-ocean heat content (averaged across 180°-100°W) increased appreciably during February [Fig. 3], due to an increase in above-average temperatures at depth in association with a downwelling equatorial oceanic Kelvin wave [Fig. 4]. Enhanced equatorial convection prevailed near the Date Line, while suppressed convection was observed over Indonesia [Fig. 5]. Low-level wind anomalies were westerly in the central Pacific Ocean, while upper-level wind anomalies were mostly westerly over the far western and far eastern Pacific. The equatorial and traditional Southern Oscillation Index values were both negative (-1.4 standard deviations). Overall, these features are consistent with weak El Niño conditions.
The majority of models in the IRI/CPC plume predict a Niño 3.4 index of +0.5°C or greater through the Northern Hemisphere early autumn 2019 [Fig. 6]. Given the recent downwelling Kelvin wave, and the increase in both the SSTs and subsurface ocean temperatures, most forecasters expect positive SST anomalies to persist across the central and eastern Pacific for at least the next several months. During that time, forecasters predict the SST anomalies in the Niño 3.4 region to remain between +0.5°C and +1.0°C, indicating weak El Niño conditions. However, because forecasts made during spring tend to be less accurate, the predicted chance that El Niño will persist beyond summer is currently about 50%. In summary, weak El Niño conditions are likely to continue through the Northern Hemisphere spring 2019 (~80% chance) and summer (~60% chance); click CPC/IRI consensus forecast for the chance of each outcome for each 3-month period.
This discussion is a consolidated effort of the National Oceanic and Atmospheric Administration (NOAA), NOAA's National Weather Service, and their funded institutions. Oceanic and atmospheric conditions are updated weekly on the Climate Prediction Center web site (El Niño/La Niña Current Conditions and Expert Discussions). Forecasts are also updated monthly in the Forecast Forum of CPCs Climate Diagnostics Bulletin. Additional perspectives and analysis are also available in an ENSO blog. The next ENSO Diagnostics Discussion is scheduled for 11 April 2019.
To receive an e-mail notification when the monthly ENSO Diagnostic Discussions are released, please send an e-mail message to: ncep.list.enso-update@noaa.gov.
[/FONT] [FONT=verdana,arial,serif] Climate Prediction Center
5830 University Research Court
College Park, Maryland 20740[/FONT]
the temperatures
the temperatures
time for the inspection of the earth's thermometer
it's a warm thermometer, temps edged up up in march
in particular a +1.06 C temperature over the old average temps
it's been estimated that if we see +2 C a very different world shows up
so we've burned through 1 C already, the runway is shrinking
March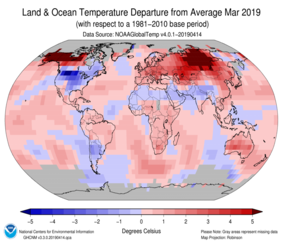
March 2019 Blended Land and Sea Surface
Temperature Anomalies in degrees Celsius
March 2019 Blended Land and Sea Surface
Temperature Percentiles
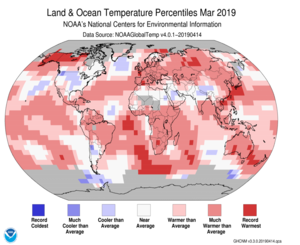
Globally, this was the second warmest March in the 140-year record, with a temperature departure from average at +1.06°C (+1.91°F). Only March 2016 was warmer at +1.24°C (+2.23°F). March 2019 also marks the third time (2016, 2017, and 2019) that the March global land and ocean surface temperature departure from average surpasses 1.0°C (1.8°F). The March 2019 global land and ocean temperature tied with January 2016 as the fifth highest monthly temperature departure from average for any month on record (1671 months). The 20 highest monthly temperature departures from average have all occurred since 2015, with March 2016 having the highest monthly temperature departure in the 1671-month record at +1.24°C (+2.23°F).
March 2019 was characterized by unusually warm conditions across much of the world's land and ocean surface. The most notable warm temperature departures from average were present across Alaska, northwestern Canada, and north-central Asia, where temperatures were at least 4.0°C (7.2°F) higher than the 1981–2010 average. Across the Southern Hemisphere, Australia and southern Africa had temperatures that were at least 1.5°C (2.7°F) above average. Record warm temperatures were present across much of Alaska, northwestern Canada and across parts of the Barents, East China, and Tasman seas, western Europe, central Russia, southern Australia, southern Atlantic and western Indian oceans, and southern Africa. Cooler-than-average March temperatures were present across parts of the contiguous U.S., southern South America, the Middle East, southern Asia, northern Africa, and across parts of the northern, central, and southern Atlantic Ocean, northern and eastern Pacific Ocean, and northern and eastern Indian Ocean. The most significant cool temperatures departures from average were limited to the northern contiguous U.S., where temperatures were 3.0°C (5.4°F) below average or cooler. However, no land or ocean surfaces had a record cold March temperature.
Although the magnitude of the ocean's surface temperature departures from average tend to be smaller than those from the land surface, averaged as a whole, the global ocean-only surface temperature was also the second highest on record for March at 0.73°C (1.31°F) above the 20th century average, trailing behind the record year 2016 (+0.82°C / +1.48°F). The global land-only surface temperature was 1.92°C (3.46°F) above the 20th century average—also the second warmest March on record, following behind 2016 (+2.39°C / +4.30°F).
Regionally, Oceania had its second highest March temperature since continental records began in 1910 at +1.76°C (+3.17°F). This value falls behind the record year 2016 by 0.10°C (0.18°F). Europe, Africa, the Caribbean Region, and Asia had a March temperature that ranked among the nine warmest Marchs on record. Meanwhile, South America had its least warm March since 2014.
Select national information is highlighted below. Please note that different countries report anomalies with respect to different base periods. The information provided here is based directly upon these data:
the temperatures
time for the inspection of the earth's thermometer
it's a warm thermometer, temps edged up up in march
in particular a +1.06 C temperature over the old average temps
it's been estimated that if we see +2 C a very different world shows up
so we've burned through 1 C already, the runway is shrinking
March

March 2019 Blended Land and Sea Surface
Temperature Anomalies in degrees Celsius

March 2019 Blended Land and Sea Surface
Temperature Percentiles
Globally, this was the second warmest March in the 140-year record, with a temperature departure from average at +1.06°C (+1.91°F). Only March 2016 was warmer at +1.24°C (+2.23°F). March 2019 also marks the third time (2016, 2017, and 2019) that the March global land and ocean surface temperature departure from average surpasses 1.0°C (1.8°F). The March 2019 global land and ocean temperature tied with January 2016 as the fifth highest monthly temperature departure from average for any month on record (1671 months). The 20 highest monthly temperature departures from average have all occurred since 2015, with March 2016 having the highest monthly temperature departure in the 1671-month record at +1.24°C (+2.23°F).
March 2019 was characterized by unusually warm conditions across much of the world's land and ocean surface. The most notable warm temperature departures from average were present across Alaska, northwestern Canada, and north-central Asia, where temperatures were at least 4.0°C (7.2°F) higher than the 1981–2010 average. Across the Southern Hemisphere, Australia and southern Africa had temperatures that were at least 1.5°C (2.7°F) above average. Record warm temperatures were present across much of Alaska, northwestern Canada and across parts of the Barents, East China, and Tasman seas, western Europe, central Russia, southern Australia, southern Atlantic and western Indian oceans, and southern Africa. Cooler-than-average March temperatures were present across parts of the contiguous U.S., southern South America, the Middle East, southern Asia, northern Africa, and across parts of the northern, central, and southern Atlantic Ocean, northern and eastern Pacific Ocean, and northern and eastern Indian Ocean. The most significant cool temperatures departures from average were limited to the northern contiguous U.S., where temperatures were 3.0°C (5.4°F) below average or cooler. However, no land or ocean surfaces had a record cold March temperature.
Although the magnitude of the ocean's surface temperature departures from average tend to be smaller than those from the land surface, averaged as a whole, the global ocean-only surface temperature was also the second highest on record for March at 0.73°C (1.31°F) above the 20th century average, trailing behind the record year 2016 (+0.82°C / +1.48°F). The global land-only surface temperature was 1.92°C (3.46°F) above the 20th century average—also the second warmest March on record, following behind 2016 (+2.39°C / +4.30°F).
Regionally, Oceania had its second highest March temperature since continental records began in 1910 at +1.76°C (+3.17°F). This value falls behind the record year 2016 by 0.10°C (0.18°F). Europe, Africa, the Caribbean Region, and Asia had a March temperature that ranked among the nine warmest Marchs on record. Meanwhile, South America had its least warm March since 2014.
Select national information is highlighted below. Please note that different countries report anomalies with respect to different base periods. The information provided here is based directly upon these data:
- Alaska had its warmest March since statewide records began in 1925, with a mean temperature that was 8.8°C (15.9°F) above the 1925–2000 base period, surpassing the previous record set in 1965 by +2.1°C (+3.7°F).
- Spain's nationally-averaged maximum temperature for March 2019 was the highest of the 21st century at 1.8°C (3.2°F) above the 1981–2010 average. This value is 0.4°C (0.7°F) higher than the previous record set in 2012. Meanwhile, Spain's minimum temperature was 0.5°C (0.9°F) below average. The above-average maximum temperature in combination with below-average minimum temperature resulted in a remarkable diurnal mean thermal oscillation which was 2.3°C (4.1°F) higher than average. The March 2019 mean temperature for Spain was 0.7°C (1.3°F) above average.
- Warmer-than-average temperatures were present across much of Germany during March 2019. The nationally-averaged March temperature was 6.6°C (43.9°F) or 2.3°C (4.1°F) above the 1981–2010 average. This value ranked as Germany's eighth highest March temperature since national records began in 1881.
- Hong Kong had its fourth highest March temperature at 21.0°C (69.8°F), which is 1.9°C (3.4°F) above average. The minimum temperature for Hong Kong was also warmer than average at 19.1°C (66.4°F) or 2.2°C (4.0°F) above average and the third highest on record.
- New Zealand's March 2019 temperature was 17.6°C (63.7°F), which is 1.9°C (3.4°F) above the 1981–2010 average. This value tied with 1999 as the second highest March temperature on record. According to NIWA, New Zealand hasn't experienced a below-average monthly temperature since January 2017. Many stations across New Zealand had record or near-record March temperatures. Of note, Ranfurly (located in the South Island) had a mean maximum temperature of 23.4°C (74.1°F) or 4.0°C (7.2°F) above average—the highest mean maximum temperature for Ranfurly since records began in 1897.
- Australia's nationally-averaged mean temperature for March 2019 was the highest on record at 2.13°C (3.83°F) above the 1961–1990 average. This value exceeded the previous record by 0.26°C (0.47°F) set in 2016. The nation's maximum and minimum temperatures were the second highest on record March temperature at +2.35°C (+4.23°F) and +1.90°C (+3.42°F), respectively. The warmest maximum temperature was set in 1986 (+2.53°C / +4.55°F); the warmest minimum temperature was set in 2016 (+2.11°C / +3.80°F). Regionally, Western Australia and Northern Territory also had their highest mean temperature on record for March. Several stations set new records for the highest number of consecutive days with temperatures at least 39.0°C (102.2°F). Of note, Rabbit Flat in the Northern Territory had a total of 115 consecutive days (1 December 2018–25 March 2019) with temperatures at least 39.0°C (102.2°F)—surpassing the previous record of 106 consecutive days (9 November 1921–22 February 1922) set in Marble Bar in Western Australia.
St. Phatty
Active member
Read an interesting article about the 2004 & 2005 earthquakes in Sumatra & the tidal waves that resulted.
http://www.tectonics.caltech.edu/outreach/highlights/sumatra/what.html

http://www.tectonics.caltech.edu/outreach/highlights/sumatra/what.html
The 10 Warning Signs For Cults Applied To Climate Change
By Will
Have you thought to yourself that the Climate Change movement seems more and more like a religious movement?
I have, so I researched how to identify a religious cult. Rick Ross, an expert on cults and intervention specialist, developed a list of ten warning signs for unsafe groups, which is published by the Cult Education Institute.
So let’s take a look at all ten signs and compare:
1. Absolute authoritarianism without meaningful accountability.
The leading advocates of the Climate Change movement are politicians, entertainers, and even children. Climate preachers such as Al Gore and Leonardo DiCaprio lack any formal scientific training whatsoever, and live personal lives of unparalleled luxury while prescribing carbon austerity for the masses. Yet no one is permitted to point out their scientific ignorance or call attention to their hypocritical lifestyles.
Child advocates such as Greta Thuneberg and the crudely indoctrinated children of the “Sunrise movement” are essentially sock puppets for their shameless activist handlers. Refuse to bend the knee to these tiny fascists, as Diane Feinstein most recently did, and the mainstream left will relentlessly attack you as an accessory to mass murder.
The authority of Climate Change leaders is entirely unmerited and absolute, yet no one is permitted to hold them accountable for their ignorance, inexperience, or brazen lies. Thus, the Climate Change movement clearly meets the first warning sign for unsafe groups.
2. No tolerance for questions or critical inquiry.
The conclusions of the Climate Change movement may not be challenged or questioned under any circumstances. Those who dare scrutinize the conclusions, methodology, or prescriptions of “climate scientists” are categorically dismissed as a “Climate Denier”, an excommunicated untouchable whose opinion is no longer valid on any subject.
Questions and critical inquiry aren’t merely dismissed or refuted. The unfortunate heretic immediately experiences a relentless ad hominem onslaught of scorn and hatred from the political and media left, and is often subjected to accusations of outright murder. Simply question the effectiveness of a “carbon tax” and you may find yourself tied to a stake.
There is no tolerance for questioning the Climate Change movement, and thus it clearly meets the second warning sign for unsafe groups.
3. No meaningful financial disclosure regarding budget, expenses such as an independently audited financial statement.
Hardly anyone knows just how much money is spent on “Climate research” every year. The cost is spread out among laughably useless study grants, wind and solar farm subsidies, carbon offset credits, “green” building code evaluation and enforcement, salaries for bureaucrats solely dedicated to “climate concerns”……you get the idea, it’s a lot of hazy money.
The abhorrent practice of “sue and settle” was a flat out money laundering scheme that allowed sympathetic government officials to transfer millions of tax dollars to radical leftist environmental groups. The practice only ended when the Trump administration used executive power to clamp down on it.
The total amount of yearly financial expenditure on the Climate Change movement is vague, difficult to track, and often carried out in unethical manners. Thus, the Climate Change movement exhibits the third warning sign for unsafe groups.
4. Unreasonable fear about the outside world, such as impending catastrophe, evil conspiracies and persecutions.
This one is pretty obvious. The Climate Change movement always shouts out revised and updated apocalypse predictions, eerily reminiscent of the stereotypical bum on the sidewalk with that “The End Is Near” sign. “The world will end in X years if we don’t do X” is the constant refrain. The years always pass, and the apocalypse never happens. Interestingly, this is a characteristic of multiple religious cults (such as the Seekers of Chicago, and the Order of the Solar Temple). At the moment, we apparently have 12 years to nationalize the entire economy and phase out fossil fuels before we all die a fiery death.
There’s also no shortage of conspiracy theories about who they consider to be Earth’s greatest saboteurs. They have an enemies list. The fossil fuel industry is at the top of it, with widespread tinfoil hat theories about oil companies burying patents for efficient renewable fuel recipes to keep us all guzzling gasoline.
The “repent or burn” doomsday preaching is the most well-known staple of the Climate Change movement, and quite clearly exemplifies the fourth warning sign for unsafe groups.
5. There is no legitimate reason to leave, former followers are always wrong in leaving, negative or even evil.
Climate alarmists who leave, step back from, or even lightly criticize the movement are immediately subjected to vicious smear campaigns. Dutch professor Richard Tol experienced this phenomenon firsthand when he removed his name from an IPCC climate report and criticized the reports excessively apocalyptic predictions.
The smear campaign was led by Bob Ward, director of policy at the London School of Economics’ Grantham Research Institute on Climate Change ‘This has all the characteristics of a smear campaign”, Tol said. “It’s all about taking away my credibility as an expert.”
The treatment of Professor Tol is not uncommon, and clearly demonstrates that the Climate Change movement exhibits the fifth warning sign for unsafe groups.
6. Former members often relate the same stories of abuse and reflect a similar pattern of grievances.
Professor Tol is not an anomaly. Dr. Richard Lindzen of MIT, Dr. Nils-Axel Mörner, and countless other former IPCC in-crowd climate experts were subjected to smear campaigns from their colleagues and the news media for the crime of throwing cold water on the outlandish predictions of the Climate Change movement.
This pattern is all too familiar to anyone who has studied what happens to individuals who leave the Church of Scientology, and clearly meets the sixth warning sign for unsafe groups.
7. There are records, books, news articles, or television programs that document the abuses of the group/leader.
The abuses of the Climate Change movement are loud and proud. They vociferously attack their perceived enemies for public consumption, and are cheered on by fellow travelers in the journalism class. Most recently they brainwashed a bunch of kids and marched them into an octogenarian Democrat Senator’s office to beg not to be murdered by a ‘No’ vote on impossible legislation. Have you seen those kids in Diane Feinstein’s office? You should, it’s creepy, here they are:
8. Followers feel they can never be “good enough.”
The atonement process for Climate warriors always demands more. It started with using a recycling bin and grocery bags. Now, in 2019, being a good follower means imposing veganism on the masses and issuing fatwahs against innocuous objects such as plastic straws and grocery bags. Despite all the efforts of the faithful, Climate minions maintain a constant state of dread and despair, knowing they can never truly do enough to stop the coming doom.
Clearly, the eighth warning sign for unsafe groups applies to the Climate Change movement.
9. The group/leader is always right.
When have the climate leaders been called wrong for their failed predictions? Regardless of the weather, they are always intrinsically correct.
Flood? Climate Change. Drought? Climate Change.
No Snow? Climate Change. Too much snow? Climate Change.
Tornado? Climate Change. Hurricane? Climate Change. Lack of hurricanes? Climate Change.
See how this works?
One of the best aspects of the movement is “weather is climate until it isn’t”. The acolytes of Climate Change will point out the window in a heat wave and say, “See? We’re right!”
If a skeptic points out the window during a blizzard, the same acolytes will simply cry “Weather isn’t climate!” It’s a game they can never lose, one in which they are never wrong and always right.
Thus, the ninth warning sign for unsafe groups clearly applies.
10. The group/leader is the exclusive means of knowing “truth” or receiving validation, no other process of discovery is really acceptable or credible.
The path to discovery for the Climate Change movement is an intentionally vague discipline referred to as “climate science”.
Did you carry out a study on gender and glaciers? Climate Science.
Did you think up the worst possible scenarios that have no actual chance of happening (actual portion of latest National Climate Assessment)? Climate Science.
Any “science” that confirms the tenets of the Climate Change movement is deemed “climate science”, while actual scientific research that disputes their conclusions is derided as “denialism”.
The tenth warning sign for unsafe groups is clearly met.
The Verdict: It’s a cult
According to the established, scientific guidelines developed by cult experts, the Climate Change movement fits the bill for a potentially unsafe group.
When I looked up these established warning signs, I honestly expected Climate Changeists to meet two or three of them, NOT TEN! The disturbingly religious nature of this supposedly “scientific” movement should alarm any thinking human being, especially since the movement now openly seeks to nationalize the entire economy.
It’s time for conservatives to realize what they are dealing with, and act accordingly. Rather than debating Climate Change activists, it may be time to start staging interventions.
If someone you know is a member of the Climate Change Movement, and you are interested in intervention strategies, please visit https://culteducation.com/prep_faq.html.
By Will
Have you thought to yourself that the Climate Change movement seems more and more like a religious movement?
I have, so I researched how to identify a religious cult. Rick Ross, an expert on cults and intervention specialist, developed a list of ten warning signs for unsafe groups, which is published by the Cult Education Institute.
So let’s take a look at all ten signs and compare:
1. Absolute authoritarianism without meaningful accountability.
The leading advocates of the Climate Change movement are politicians, entertainers, and even children. Climate preachers such as Al Gore and Leonardo DiCaprio lack any formal scientific training whatsoever, and live personal lives of unparalleled luxury while prescribing carbon austerity for the masses. Yet no one is permitted to point out their scientific ignorance or call attention to their hypocritical lifestyles.
Child advocates such as Greta Thuneberg and the crudely indoctrinated children of the “Sunrise movement” are essentially sock puppets for their shameless activist handlers. Refuse to bend the knee to these tiny fascists, as Diane Feinstein most recently did, and the mainstream left will relentlessly attack you as an accessory to mass murder.
The authority of Climate Change leaders is entirely unmerited and absolute, yet no one is permitted to hold them accountable for their ignorance, inexperience, or brazen lies. Thus, the Climate Change movement clearly meets the first warning sign for unsafe groups.
2. No tolerance for questions or critical inquiry.
The conclusions of the Climate Change movement may not be challenged or questioned under any circumstances. Those who dare scrutinize the conclusions, methodology, or prescriptions of “climate scientists” are categorically dismissed as a “Climate Denier”, an excommunicated untouchable whose opinion is no longer valid on any subject.
Questions and critical inquiry aren’t merely dismissed or refuted. The unfortunate heretic immediately experiences a relentless ad hominem onslaught of scorn and hatred from the political and media left, and is often subjected to accusations of outright murder. Simply question the effectiveness of a “carbon tax” and you may find yourself tied to a stake.
There is no tolerance for questioning the Climate Change movement, and thus it clearly meets the second warning sign for unsafe groups.
3. No meaningful financial disclosure regarding budget, expenses such as an independently audited financial statement.
Hardly anyone knows just how much money is spent on “Climate research” every year. The cost is spread out among laughably useless study grants, wind and solar farm subsidies, carbon offset credits, “green” building code evaluation and enforcement, salaries for bureaucrats solely dedicated to “climate concerns”……you get the idea, it’s a lot of hazy money.
The abhorrent practice of “sue and settle” was a flat out money laundering scheme that allowed sympathetic government officials to transfer millions of tax dollars to radical leftist environmental groups. The practice only ended when the Trump administration used executive power to clamp down on it.
The total amount of yearly financial expenditure on the Climate Change movement is vague, difficult to track, and often carried out in unethical manners. Thus, the Climate Change movement exhibits the third warning sign for unsafe groups.
4. Unreasonable fear about the outside world, such as impending catastrophe, evil conspiracies and persecutions.
This one is pretty obvious. The Climate Change movement always shouts out revised and updated apocalypse predictions, eerily reminiscent of the stereotypical bum on the sidewalk with that “The End Is Near” sign. “The world will end in X years if we don’t do X” is the constant refrain. The years always pass, and the apocalypse never happens. Interestingly, this is a characteristic of multiple religious cults (such as the Seekers of Chicago, and the Order of the Solar Temple). At the moment, we apparently have 12 years to nationalize the entire economy and phase out fossil fuels before we all die a fiery death.
There’s also no shortage of conspiracy theories about who they consider to be Earth’s greatest saboteurs. They have an enemies list. The fossil fuel industry is at the top of it, with widespread tinfoil hat theories about oil companies burying patents for efficient renewable fuel recipes to keep us all guzzling gasoline.
The “repent or burn” doomsday preaching is the most well-known staple of the Climate Change movement, and quite clearly exemplifies the fourth warning sign for unsafe groups.
5. There is no legitimate reason to leave, former followers are always wrong in leaving, negative or even evil.
Climate alarmists who leave, step back from, or even lightly criticize the movement are immediately subjected to vicious smear campaigns. Dutch professor Richard Tol experienced this phenomenon firsthand when he removed his name from an IPCC climate report and criticized the reports excessively apocalyptic predictions.
The smear campaign was led by Bob Ward, director of policy at the London School of Economics’ Grantham Research Institute on Climate Change ‘This has all the characteristics of a smear campaign”, Tol said. “It’s all about taking away my credibility as an expert.”
The treatment of Professor Tol is not uncommon, and clearly demonstrates that the Climate Change movement exhibits the fifth warning sign for unsafe groups.
6. Former members often relate the same stories of abuse and reflect a similar pattern of grievances.
Professor Tol is not an anomaly. Dr. Richard Lindzen of MIT, Dr. Nils-Axel Mörner, and countless other former IPCC in-crowd climate experts were subjected to smear campaigns from their colleagues and the news media for the crime of throwing cold water on the outlandish predictions of the Climate Change movement.
This pattern is all too familiar to anyone who has studied what happens to individuals who leave the Church of Scientology, and clearly meets the sixth warning sign for unsafe groups.
7. There are records, books, news articles, or television programs that document the abuses of the group/leader.
The abuses of the Climate Change movement are loud and proud. They vociferously attack their perceived enemies for public consumption, and are cheered on by fellow travelers in the journalism class. Most recently they brainwashed a bunch of kids and marched them into an octogenarian Democrat Senator’s office to beg not to be murdered by a ‘No’ vote on impossible legislation. Have you seen those kids in Diane Feinstein’s office? You should, it’s creepy, here they are:
Everyone needs to watch this video of @SenFeinstein disparaging literal children from @SunriseMvmt calling on her to support @AOC and @SenMarkey’s Green New Deal.pic.twitter.com/SjF8thnucQ
— Waleed Shahid (@_waleedshahid) February 22, 2019
These tantrums and protests aren’t only meant to rally supporters of the Climate Change movement. They are a form of intimidation, a tactic used to silence those who question the gospel. There is ample evidence that the Climate Change movement meets the seventh warning sign of an unsafe group.— Waleed Shahid (@_waleedshahid) February 22, 2019
8. Followers feel they can never be “good enough.”
The atonement process for Climate warriors always demands more. It started with using a recycling bin and grocery bags. Now, in 2019, being a good follower means imposing veganism on the masses and issuing fatwahs against innocuous objects such as plastic straws and grocery bags. Despite all the efforts of the faithful, Climate minions maintain a constant state of dread and despair, knowing they can never truly do enough to stop the coming doom.
Clearly, the eighth warning sign for unsafe groups applies to the Climate Change movement.
9. The group/leader is always right.
When have the climate leaders been called wrong for their failed predictions? Regardless of the weather, they are always intrinsically correct.
Flood? Climate Change. Drought? Climate Change.
No Snow? Climate Change. Too much snow? Climate Change.
Tornado? Climate Change. Hurricane? Climate Change. Lack of hurricanes? Climate Change.
See how this works?
One of the best aspects of the movement is “weather is climate until it isn’t”. The acolytes of Climate Change will point out the window in a heat wave and say, “See? We’re right!”
If a skeptic points out the window during a blizzard, the same acolytes will simply cry “Weather isn’t climate!” It’s a game they can never lose, one in which they are never wrong and always right.
Thus, the ninth warning sign for unsafe groups clearly applies.
10. The group/leader is the exclusive means of knowing “truth” or receiving validation, no other process of discovery is really acceptable or credible.
The path to discovery for the Climate Change movement is an intentionally vague discipline referred to as “climate science”.
Did you carry out a study on gender and glaciers? Climate Science.
Did you think up the worst possible scenarios that have no actual chance of happening (actual portion of latest National Climate Assessment)? Climate Science.
Any “science” that confirms the tenets of the Climate Change movement is deemed “climate science”, while actual scientific research that disputes their conclusions is derided as “denialism”.
The tenth warning sign for unsafe groups is clearly met.
The Verdict: It’s a cult
According to the established, scientific guidelines developed by cult experts, the Climate Change movement fits the bill for a potentially unsafe group.
When I looked up these established warning signs, I honestly expected Climate Changeists to meet two or three of them, NOT TEN! The disturbingly religious nature of this supposedly “scientific” movement should alarm any thinking human being, especially since the movement now openly seeks to nationalize the entire economy.
It’s time for conservatives to realize what they are dealing with, and act accordingly. Rather than debating Climate Change activists, it may be time to start staging interventions.
If someone you know is a member of the Climate Change Movement, and you are interested in intervention strategies, please visit https://culteducation.com/prep_faq.html.
greenland calling
greenland calling
the greenland ice melt is having quite an early start this year
kind of spectacular at the moment
will it persist? if it does everyone will be well informed soon
greenland calling
the greenland ice melt is having quite an early start this year
kind of spectacular at the moment
will it persist? if it does everyone will be well informed soon
Attachments
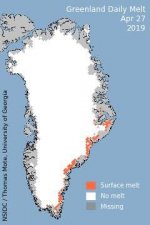
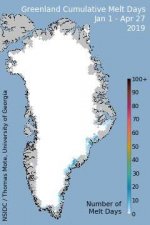
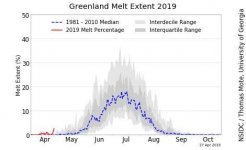
St. Phatty
Active member
lol we are all going to FRY, unless we freeze to death first
this thread should turn interesting now, you blokes are coming out of hibernation
So many of the places that people have settled, they picked the location because the weather was nice - in the past.
Us human beings are so sensitive to temperature. Especially as we get older

Then things change a little bit ...
I read that Russia burned about 10,000 square miles of forest in a recent year. Boy that'll raise CO2 levels in the old grow-room that is Planet Earth.
M
moose eater
Tanana River at the Village of Nenana just went out 6 days earlier than recorded in the last ~110 years. It was also some of the thinnest ice recorded there this winter.
The glacier that fed Kluane Lake (a 35-40 mile-long, north-to-south, lake in Canada's Yukon Territory) receded far enough a couple years ago, that, though it had previously provided the inlet water to Kluane Lake and another nearby lake in the region, it now no longer feeds Kluane Lake. Water levels there were measurably sinking as of last year.
Ice fishing in the Wrangell-St. Elias Mountain Range, where my son(s) and I go each later winter/early spring, in the hills there, is not as it once was, either. While we used to have -10 f or even a bit colder in the mornings, pre-sun-up, near the end of March, warming to +30 to +50 by afternoon, depending, now it doesn't typically reach those colder morning temps for the most part, after mid-March. And the trail we take in is showing more and more mud, rock, and tussocks by the time we leave the third or fourth week of March, despite going in earlier than we once did each year these last couple years or so..
My friend's homestead in the northern side of the Alaska Range, at ~1,500 ft. elevation, had the same/similar +50 f. weather we had this year in the last half of March, seemingly unheard of, and he called me on March 30, reporting bumble bees and butterflies in his yard. I have seen -30 f and -40 f in early to later March in years past, and NEVER saw these kinds of warmer temps.
Ice thickness on numerous lakes we've fished in the Yukon Territory has diminished, and the freeze-up dates have moved further back into the later Fall, and even early Winter. Break-up now comes earlier there.
Our summers in Interior Alaska used to be much more dry, and quite warm, often reaching into the 90s f in later June and July. While we've had some notably warmer early spring time weather over the last decade, our summers are more wet and cooler, and the August rains now arrive earlier and earlier.
We've been classified as an 'arctic desert' climate in the Interior, but in recent years, I've questioned that designation, with cause..
30-40 years ago here, it was not uncommon to see 3-6 weeks in winter of -30 f. to -60 f cold spells. haven't seen but 1 or 2 days of -40 f. to -50 f. this last year. More or less similar to the last bunch of years.
I've been an Alaska resident for 41 years, and lived in the Yukon Territory of Canada before that for a bit. Nope, things in the sub-arctic and arctic are changing, without a doubt. And the storms are changing and intensifying with it.

