What's new
  • Happy Birthday ICMag! Been 20 years since Gypsy Nirvana created the forum! We are celebrating with a 4/20 Giveaway and by launching a new Patreon tier called "420club". You can read more here.
  • Important notice: ICMag's T.O.U. has been updated. Please review it here. For your convenience, it is also available in the main forum menu, under 'Quick Links"!

Have you looked at the North Pole lately?

trichrider

Kiss My Ring
Veteran
https://www.thegwpf.org/content/upl...ail&utm_term=0_fe4b2f45ef-50776019b7-20171477


Garth W. Paltridge DScFAA is an atmospheric physicist and was a chief research scientist with the CSIRO Division of Atmospheric Research before his appointment in 1990 to the University of Tasmania as Director of the Institute of Antarctic and Southern Ocean Studies and (in1992) as CEO of the Antarctic Cooperative Research Centre. He is currently Emeritus Profes-
sor at the University of Tasmania and a Visiting Fellow at the Australian National University. He is best known internationally for his work on atmospheric radiation and the theoretical basis of climate. He is a fellow of the Australian Academy of Science and a member of the Academic Advisory Council of the GWPF.


probably a reason you won't read or watch the videos i post.
frailty of logic. skepticism is the basis of science, but you're sold on the propaganda.
for everyones sake, i pray i'm wrong. i would much prefer warming.

and Cannavore, you are lying about potholder debunking anything i've posted.
just plain lying...like Mann et al. and his hockey stick.

i've been posting contemporaneous science articles and tools to find your way...where is the debunking?

http://cci-reanalyzer.org/wx/DailySummary/#seaice-snowc-topo

http://ocean.dmi.dk/arctic/icecover.uk.php

https://earth.nullschool.net/

...and a half dozen vloggers contradicting the 'settled science'.

you cannot debunk in absentia!
let us all see what you say is debunking...starting with the article by a PHD in atmospheric physics linked above.

your posts show no science about atmosphere or any sphere and are only meant to disparage my message and minimize its impact.

don't be fake. don't buy into the cult.
 

trichrider

Kiss My Ring
Veteran
The Snowball Earth hypothesis proposes that Earth surface's became entirely or nearly entirely frozen at least once, sometime earlier than 650 Mya (million years ago).

715 million years ago the entire planet was encased in snow and ice. This frozen wasteland may have been the birthplace of complex animals


View Image

May 14, 2018
Orbital variations can trigger ‘snowball’ states in habitable zones around sunlike stars

Peter Kelley UW News

A NASA artist’s impression of Earth as a frigid “‘snowball” planet.

New research from the University of Washington indicates that aspects of an otherwise habitable-seeming exoplanet planet’s axial tilt or orbit could trigger such a snowball state, where oceans freeze and surface life is impossible.NASA

Aspects of an otherwise Earthlike planet’s tilt and orbital dynamics can severely affect its potential habitability — even triggering abrupt “snowball states” where oceans freeze and surface life is impossible, according to new research from astronomers at the University of Washington.

The research indicates that locating a planet in its host star’s “habitable zone” — that swath of space just right to allow liquid water on an orbiting rocky planet’s surface — isn’t always enough evidence to judge potential habitability.

Russell Deitrick, lead author of a paper to be published in the Astronomical Journal, said he and co-authors set out to learn, through computer modeling, how two features — a planet’s obliquity or its orbital eccentricity — might affect its potential for life. They limited their study to planets orbiting in the habitable zones of “G dwarf” stars, or those like the sun.

A planet’s obliquity is its tilt relative to the orbital axis, which controls a planet’s seasons; orbital eccentricity is the shape, and how circular or elliptical — oval — the orbit is. With elliptical orbits, the distance to the host star changes as the planet comes closer to, then travels away from, its host star.

Deitrick, who did the work while with the UW, is now a post-doctoral researcher at the University of Bern. His UW co-authors are atmospheric sciences professor Cecilia Bitz, astronomy professors Rory Barnes, Victoria Meadows and Thomas Quinn and graduate student David Fleming, with help from undergraduate researcher Caitlyn Wilhelm.

The Earth hosts life successfully enough as it circles the sun at an axial tilt of about 23.5 degrees, wiggling only a very little over the millennia. But, Deitrick and co-authors asked in their modeling, what if those wiggles were greater on an Earthlike planet orbiting a similar star?

Previous research indicated that a more severe axial tilt, or a tilting orbit, for a planet in a sunlike star’s habitable zone — given the same distance from its star — would make a world warmer. So Deitrick and team were surprised to find, through their modeling, that the opposite reaction appears true.

“We found that planets in the habitable zone could abruptly enter ‘snowball’ states if the eccentricity or the semi-major axis variations — changes in the distance between a planet and star over an orbit — were large or if the planet’s obliquity increased beyond 35 degrees,” Deitrick said.

The new study helps sort out conflicting ideas proposed in the past. It used a sophisticated treatment of ice sheet growth and retreat in the planetary modeling, which is a significant improvement over several previous studies, co-author Barnes said.

“While past investigations found that high obliquity and obliquity variations tended to warm planets, using this new approach, the team finds that large obliquity variations are more likely to freeze the planetary surface,” he said. “Only a fraction of the time can the obliquity cycles increase habitable planet temperatures.”

Barnes said Deitrick “has essentially shown that ice ages on exoplanets can be much more severe than on Earth, that orbital dynamics can be a major driver of habitability and that the habitable zone is insufficient to characterize a planet’s habitability.”

The research also indicates, he added, “that the Earth may be a relatively calm planet, climate-wise.”

This kind of modeling can help astronomers decide which planets are worthy of precious telescope time, Deitrick said: “If we have a planet that looks like it might be Earth-like, for example, but modeling shows that its orbit and obliquity oscillate like crazy, another planet might be better for follow-up” with telescopes of the future.”

The main takeaway of the research, he added, is that “We shouldn’t neglect orbital dynamics in habitability studies.”

Other co-authors are Benjamin Charnay, a former UW post-doctoral researcher now with the LESIA Observatoire de Paris; and John Armstrong of Weber State University, who earned his doctorate at the UW.

The research used storage and networking infrastructure provided by the Hyak supercomputer system at the UW, funded by the UW’s Student Technology Fee. The work was funded by the NASA Astrobiology Institute through the UW-based Virtual Planetary Laboratory.
###​
For more information, contact Deitrick at deitrr@astro.washington.edu or russell.deitrick@csh.unibe.ch; or Barnes at rory@astro.washington.edu.
 

trichrider

Kiss My Ring
Veteran
https://www.youtube.com/watch?v=V0jdPQ9aGbY

[youtubeif]V0jdPQ9aGbY[/youtubeif]

Calculating Planetary Surface Temperatures Made Easy

I have decided to adhere to convention and replace the n with an M. This is to avoid confusion with n which is used by many as the number of moles - not the mean molecular weight. So the formula is now; T = PM/Rρ T = near-surface atmospheric temperature in Kelvin P = near-surface atmospheric pressure in kPa R = gas constant 8.314 ρ = near-surface atmospheric density in kg/m³ M = near-surface atmospheric mean molecular weight (grams per mole)

Where is the supposed 33C "Greenhouse Effect"? A GHE of the size claimed by the IPCC or the 'mainstream' climate scientists simply can't be 'baked in' to this formula. Firstly you have the 'problem' of the claimed 33C from the GHE, which because of the gas law results incorporating auto-compression has disappeared. There is also the second problem that if the temperature can be accurately calculated by knowing just three gas parameters, then the climate sensitivity to CO2 has to be extremely low, not more than 0.02C which means that the CO2 alarm is totally unnecessary. In effect, the formula proves that 'extra' CO2 has no more effect than more of any other gas has on temperatures. A hypothesis is presented here that near-surface planetary temperatures on bodies with atmospheric pressures of over10kPa are significantly increased over and above the S-B black body law by a process known as adiabatic auto-compression and not the so-called "greenhouse effect". The proof lies in the formula shown here, which is derived from the Ideal gas law. It is demonstrated that by knowing just three near-surface gas parameters, the actual average near-surface atmospheric temperature of such bodies can be easily calculated. In this video, we look at a simple, alternative way to calculate the average surface atmospheric temperature of a planetary body which has a surface atmospheric pressure of over 10kPa. This turns out to be a re-arrangement of the Ideal Gas Law. Using this formula, the planetary surface temperature can be accurately determined by knowing just three gas parameters; - Average near-surface atmospheric pressure - Average near-surface atmospheric density - Near-surface mean atmospheric molecular weight This calls into question as to whether the probable 33C surface temperature enhancement on Earth - is really a "Greenhouse Effect" caused by greenhouse gases, or whether it has another cause; namely Adiabatic Auto-Compression.

References; Here are the results at 1 bar of pressure (101.3kPa); Jupiter: 165 K (observed) vs 167 K (calculated) Saturn: 134 K (observed) vs 132.8 K (calculated) Uranus: 76 K (observed) vs 76.6 K (calculated) Neptune: 72 K (observed) vs between 68.5 K and 72.8 K (calculated) Use NASA figures; Jupiter; https://nssdc.gsfc.nasa.gov/planetary...
Saturn; https://nssdc.gsfc.nasa.gov/planetary...
Uranus; https://nssdc.gsfc.nasa.gov/planetary...
Neptune; https://nssdc.gsfc.nasa.gov/planetary...
Fulchignoni, M., Ferri, F., Angrilli, F., Ball, A. J., Bar-Nun, A., Barucci, M. A., ... & Coradini,, M. (2005). In situ measurements of the physical characteristics of Titan's environment. Nature, 438(7069), 785-791. Lindal, G. F., Wood, G., Hotz, H., Sweetnam, D., Eshleman, V., & Tyler, G. (1983). The atmosphere of Titan: An analysis of the Voyager 1 radio occultation measurements. Icarus, 53(2), 348-363. NASA fact sheet data on the planets, (2017). Accessed 10/4/2017 https://nssdc.gsfc.nasa.gov/planetary... Schmidt, G. A., Ruedy, R. A., Miller, R. L., & Lacis, A. A. (2010). Attribution of the present‐day total greenhouse effect. Journal of Geophysical Research: Atmospheres, 115(D20). Principles, T., Nikolov, N., & Zeller, K. (2011). Unified Theory of Climate, poster session at the World Climate Research Program; https://www.wcrp-climate.org/conference 2011/ Robinson, T. D., & Catling, D. C. (2014). Common 0.1 bar tropopause in thick atmospheres set by pressure-dependent infrared transparency. Nature Geoscience, 7(1), 12-15. Wikipedia, Properties of Earth’s atmosphere, (2017). Accessed 6/4/2017. https://en.wiki pedia.org/wiki/Density_of_air Zasova, L. V., Ignatiev, N., Khatuntsev, I., & Linkin, V. (2007). Structure of the Venus atmosphere. Planetary and Space Science, 55(12), 1712-1728. Postscript; The formula also woks for the South Pole; 68.13 / (8.314.1.06/28.96) = 223.9 Kelvin (or -49 C) This is the correct average temperature at the South Pole; https://icecube.wisc.edu/pole/weather I have done a quick calculation of the climate sensitivity using this formula, and it is less than 0.03C.

:tiphat:
 

trichrider

Kiss My Ring
Veteran
Wednesday, 30 May 2018
The Politically Motivated Science of Climatology and the Demonization of Carbon
Written by James Murphy

Climatology is an area of study that comes from many disciplines of science. Meteorologists, astrophysicists, geologists, geophysicists, mathematicians, and oceanographers all lay claim to the title of climatologist. The amount of data that each discipline adds to the study of climatology is astounding — so astounding that no one really understands it all yet, least of all climate alarmists such as carbon credit salesman Al Gore.


Up until the 1970s, climatology was a little-studied and poorly understood concept. We knew that climate existed, of course. We knew that the angle of the sun affected weather, and we knew what to expect in terms of seasonal variations. But no one would presume to know with any certainty if and how climate was changing. The first conclusions drawn on the subject, back in the 1970s, were that the globe was on the verge of a new glacial period in our present ice age (a glacial period is a period of advancing ice — we are still in an ice age as ice sheets still exist in Greenland, the Arctic, and Antarctic). The consensus of a cooling world at that time was 83 percent, by the way.


But the 1980s were a much warmer decade, and eventually, scientific consensus shifted to the global-warming model. In 1989, the United Nations created the Intergovernmental Panel on Climate Change (IPCC) to study the dangers of a warming globe. Not surprisingly, the IPCC and many leading scientists blamed mankind and our profligate use of fossil fuels for rising CO2 levels.

That’s when politics became involved. And lest you think that it all came from the left of the political spectrum, remember that conservative hero Margaret Thatcher of Great Britain was one of the first to call for an all-out war on global warming. But regardless of which side of the spectrum the calls for action emanated from, the die was cast. Politics became involved, and the science became suspect.


The plant food known as carbon dioxide was demonized. In 2013, the figure of 400 parts per million (PPM) was said to be a “tipping point.” It was said to be an unprecedented number — the “highest ever recorded,” and certain to cause catastrophic global warming if not curtailed immediately.


But the first accurate measurements of atmospheric CO2 began in the 1950s. Those 60 some-odd-years are hardly a long enough sample size. Back then, CO2 levels were measured at 314ppm, which makes 400ppm seem like a gigantic increase. But even at that 400ppm number, Carbon dioxide makes up 0.04 percent of the Earth’s atmosphere.


Another thing that climate scientists won’t tell you is that complex plant life depends on having at least 150ppm of CO2 in the atmosphere. Scientists estimate that carbon dioxide during the last ice age was dangerously low, only about 200ppm. It’s entirely possible to have too little CO2 in the atmosphere.


But except during times of advancing ice ages, that has not been the case. Ice core data from Antarctica shows that atmospheric CO2 has waxed and waned throughout the eons. In fact, during the Cambrian geologic time period, CO2 levels averaged nearly 6,000 ppm. Evolutionists will tell you that this was the time of the Cambrian Explosion, the time when most complex animal and plant life appeared on the Earth. Does that mean CO2 is the driver of evolution and not natural selection?


Of course not. Such a conclusion would becompletely capricious and based on incomplete data — just like the conclusions and doomsday predictions of climate alarmists today.


Princeton physicist William Happer, an honest scientist, much hated by the climate-alarmist community, has recently pushed back against the demonization of CO2. “You might call me a scientist who is persuaded that doubling or tripling CO2 in Earth’s atmosphere will be a major benefit to life on Earth,” Happer said.


Despite what Al Gore tells you, carbon dioxide is simply not a pollutant. It is one atom of carbon covalently double bonded to two oxygen atoms. We release it into the atmosphere each time we exhale. Plants need it to survive. It is a trace gas, only 0.04 percent of our atmosphere. It’s not a demon; it’s a necessity of life.


The reliability of any type of scientific study goes down in direct proportion to the amount of politics involved in that study. When the funding of science is tied to a certain outcome, said science is suspect. And that is the case with a large percentage — shall we say 97 percent? — of climatology today.


https://www.thenewamerican.com/tech...of-climatology-and-the-demonization-of-carbon
 

GMT

The Tri Guy
Veteran
420giveaway
Even when the transvestite pedo in charge of the catholic church says there is no such thing as hell, some people continue to believe in it. The same is true with climate change. There are people out there who will choose to believe what ever makes them feel better. Its called cognitive dissonance. If it doesn't serve them to believe it, and they don't have the background or ability to understand it, they never will never accept it.
At some point you have to stop trying to educate them.
 

trichrider

Kiss My Ring
Veteran
https://sci-hub.tw/

^^^^^^^^^^
using this link to avoid paywalls on most scientific papers. one can read the paper of interest by pasting the url of the paper into the search function of the above link.


for example :


https://agupubs.onlinelibrary.wiley.com/doi/abs/10.1029/2018JD028355


returns a page with the abstract of the paper of interest. below the title is a date of publishing and a url, just copy and paste the url into the search function line...


.... https://doi.org/10.1029/2018JD028355 ....


this will open the paper so you can study it.


Land surface air temperature data are considerably different among BEST‐LAND, CRU‐TEM4v, NASA‐GISS, and NOAA‐NCEI

Yuhan Rao
Shunlin Liang
Yunyue Yu


First published: 28 May 2018
https://doi.org/10.1029/2018JD028355

PDF
Tools
Share


Abstract

Several groups routinely produce gridded land surface air temperature (LSAT) datasets using station measurements to assess the status and impact of climate change. The IPCC Fifth Assessment Report (AR5) suggests that estimated global and hemispheric mean LSAT trends of different datasets are consistent. However, less attention has been paid to the inter‐comparison at local/regional scales, which is important for local/regional studies. In this study we comprehensively compare four datasets at different spatial and temporal scales, including BEST‐LAND, CRU‐TEM4v, NASA‐GISS, and NOAA‐NCEI. The mean LSAT anomalies are remarkably different because of the data coverage differences, with the magnitude nearly 0.4°C for the global and northern hemisphere and 0.6°C for the southern hemisphere. This study additionally finds that on the regional scale, northern high latitudes, southern mid‐to‐high latitudes, and the equator show the largest differences nearly 0.8°C. These differences cause notable differences for the trend calculation at regional scales. At the local scale, four datasets show significant variations over South America, Africa, the maritime continent, central Australia, and Antarctica, which leads to remarkable differences in the local trend analysis. For some areas, different datasets produce conflicting results of whether warming exists. Our analysis shows that the differences across scales are associated with the availability of stations and the use of infilling techniques. Our results suggest that conventional LSAT datasets using only station observations have large uncertainties across scales, especially over station‐sparse areas. In developing future LSAT datasets, the data uncertainty caused by limited and unevenly distributed station observations must be reduced.


be well
 

G.O. Joe

Well-known member
Veteran
Dude you realize around here we set a record amount of record high days every year. It seems to happen everywhere. Winter is gone just like the honeybees and low CO2 levels. It's not up for debate. If your spin doctors had come up with a way to blame Obama and Hillary you'd be leading the charge to prove ongoing global disaster, and they would have been hanged live on TV by Trump for it by now.
 

armedoldhippy

Well-known member
Veteran
Dude you realize around here we set a record amount of record high days every year. It seems to happen everywhere. Winter is gone just like the honeybees and low CO2 levels. It's not up for debate. If your spin doctors had come up with a way to blame Obama and Hillary you'd be leading the charge to prove ongoing global disaster, and they would have been hanged live on TV by Trump for it by now.

:woohoo: common sense rears its unpopular head! :tiphat: thank you...
 

TychoMonolyth

Boreal Curing
My family farms. Mention a climate change hoax at dinner and they'll feed you to the pigs. I never heard of running out of hay in 55 years. That was as ridiculous as no snow all winter. Now it happens every few years. Hell, we get maybe 3 weeks of enough snow on the ground to use our snowmobiles, when we used to get two full months! This is just fracking insane. And when the US corn belt starts screaming, the armchair scientists will blame china for using weather modification technology or blame HAARP for it.

Sheesh... Quit following Alex Jones people. You do know the nut bars are getting rich off you right?
 
U

Ununionized

No: a COLD NITROGEN BATH isn't a HEATER.

No matter HOW many CONS tell you otherwise.

You've got to be able to figure out if a cold nitrogen bath is really a heater, alert one.

https://www.youtube.com/watch?v=0s__qs0cBek

My family farms. Mention a climate change hoax at dinner and they'll feed you to the pigs. I never heard of running out of hay in 55 years. That was as ridiculous as no snow all winter. Now it happens every few years. Hell, we get maybe 3 weeks of enough snow on the ground to use our snowmobiles, when we used to get two full months! This is just fracking insane. And when the US corn belt starts screaming, the armchair scientists will blame china for using weather modification technology or blame HAARP for it.

Sheesh... Quit following Alex Jones people. You do know the nut bars are getting rich off you right?
 
U

Ununionized

For those of you who continue to believe a cold nitrogen bath is a magical heater, no.

Everything about the fraud is known, including how the frauds reach a temperature calculation for our Earth Atmosphere - well known since we ultimately calibrate either directly or indirectly, every instrument for measuring almost anything on the planet, against accurately known mean sea level, humidity, pressure, and temperature variables.

The Frauds refuse to make use of the Gas Law written for calculation of the temperatures of gases, instead fraudulently claiming to be able to calculate accurate temps for gases using solely Stefan-Boltzman radiation calculation process.

Stefan-Boltzman possesses no formula for accounting the 33 DEGREES of COMPRESSION WARMING

INTRINSIC to COMPRESSIBLE-PHASE FLUIDS: GASES.

Hence the NEED for - go figure - GAS LAW to calculate GAS TEMPERATURES.
=====
This alone is the ABSOLUTE scientific end for hope in the "mathematics that make a cold nitrogen bath a heater."

No and another thing that's not true and yet's been spammed worldwide by government and "world-class research university peer reviewed science" :

POT'S NOT LIKE HEROIN and WORSE for one than METHYL AMPHETAMINE EITHER.

Theyve been telling gullible people for 80 years, "an WE GOT the CRITICAL RESEARCH UNIVERSITY, SCIENTIFIC PEER REVIEW TO PROVE IT IN COURT, BUSTER! ALL the WORLD'S GREAT MEDICAL ASSOCIATIONS AGREE that DEVIL WEED is the GATEWAY to HEROIN!

Thanks Democrats for illegal pot in 1937. I don't know which has done more for our nation, your founding the Klan or making pot illegal.

And oH! LooK!

The Democrats ALSO brought you THIS

WORLD ENSLAVEMENT SCHEME

and actually TAUGHT you in SCHOOL, that "uh cold bath is a magic heedur!"

Just like they told your grandpa sitting in the SAME school desk, "That devil wead will git yew hooked on thim opioids. Yew better jist stick to opioids if you don't want to get hooked on opioids.

THAT'S THEIR MEDICAL PLATFORM THIS MOMENT of THIS HOUR of THIS DAY I WRITE IT.

GIT OFF that DEVIL WEED

or YOU ARE GONNA GET ON OPIOIDS. To STAY OFF OPIOIDS, YEW GOTTA GIT YEW SUM OPIOIDS, and NOT THAT DEVIL WEED
CAUSE IT'LL MAKE YOU GET ON OPIOIDS.

You're in here now: SIGNED IN ANONYMOUSLY: because GOVERNMENT EMPLOYEE CHEMISTRY SCAMMERS

SOLD you a story that a COLD NITROGEN BATH is a HEATER.

And that cold light blocking REFRIGERANTS in the bath are the magical CORE

of the COLD BATH that's a HEATER.

You've got to be smarter than standing there telling yourself "Thim GUVURMINT FELLURS WOODEN NEVUR LYE TWO ME, THAY'S AWL got BOW TIES and thair OWN PARKIN SPOT down two thuh YEWNIVERS'uhTEE!"

No, a COLD NITROGEN BATH is not was not will no be tomorrow, a heater.

The cold REFRIGERANTS in the bath are not the CORE of said heater

and if they are - come on in and show us all one.
---------------------------------------------------
For those of you not so prone to believe it because "Yew dun herd signtsie thangs, frum muchly speshul fellurs, sez the signts, is sownd"

We can discuss it at a level above it so - tell me if you can, - ANY of you claiming

magical gassiness made a cold bath a heater,

What's the name of the law written for solving the temperatures of gases and what happens along the way if you don't account for compression warming intrinsic to compressible phase fluids?

How many degrees does your calculation come out to be off, from the Standard

International Standard Atmosphere's values against which ultimately we calibrate and regulate nearly every instrument, motor, engine, or anything that makes heat or pressure, on the planet?

What happens to the answer?

On Earth, when calculating Earth atmosphere temperature - you come up with a mandatory shortfall if you use Stefan-Boltzmann processes only of

that's right, kids: 33 degrees.

When you USE GAS LAW
to ACCOUNT for the 33 DEGREES WARMING intrinsic to COMPRESSIBLE PHASE MATTER

your ERROR VANISHES
and just like that your answer matches the INTERNATIONAL STANDARD ATMOSPHERE,

PROPERLY depicting EARTH'S Atmosphere's ACTUAL average TEMPERATURE.

What does Magic Gas Hansen tell you "nitrogen cooled government computers" can do?

Calculate SO FAST
that THEY DON'T NEED to PROPERLY INCLUDE GAS LAW and can GET BY using ONLY STEFAN-BOLTZMANN PROCESS mathematics.

Again: WHY ARE YOUR CHURCH'S CALCULATIONS for ATMOSPHERIC TEMPS always OFF?

Not using GAS LAW
to solve Atmospheric temperature
incurring the MANDATORY 33 DEGREE SHORFALL
such
ERROR - for Hansen he was scamming grants, it was no error -

ALWAYS
CREATES.
 
Last edited:
U

Ununionized

The reasons I noted above, are why none of you who believe in the "magical gassiness that makes a cold nitrogen bath a heater"

even know the NAME of the GAS LAW your CONNING LEADERS refuse to invoke.
====================
Here's a test, environmental "pot's like heroin" class believers.

What's the name of the law of physics written by physicists specifically for solving gas temperature?

What are the laws parts?

How many parts does the law have?

Why does the law have multiple parts?

What is the formula of the law written by scientists to calculate the temperatures of gases?

If you know what you're talking about you should be able to swiftly and clearly speak on the law, since - it's only an equation.

What is the equation of the law written by scientists for solving gas temperatures?

Explain the Law's significance in science history. What does the law combine and unify that previous efforts couldn't?

We'll all wait while you stare out at the yard exclaiming to yourself and your family, that -

"it's the end times, and we're all gonna die cause we made the sky hot by usin fire!"
 
Last edited:

igrowone

Well-known member
Veteran
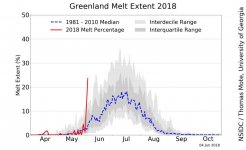
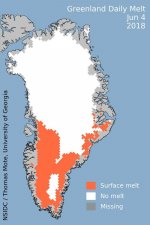
latest greenland melt

latest greenland melt

the latest from the greenland ice sheet
last year had some impressive late year melting
this year is doing some impressive moves, pictures do speak for themselves
not a prediction for the year's melt, but should not be ignored
 

Attachments

  • greenland_daily_melt.jpg
    greenland_daily_melt.jpg
    77 KB · Views: 11
  • greenland_daily_melt_plot.jpg
    greenland_daily_melt_plot.jpg
    60.6 KB · Views: 9

St. Phatty

Active member
The thing about the process of melting, is that it takes an awful lot of energy to achieve the phase conversion from solid ice to water.

Once the ice is melted, all the energy that was heating the system, to cause the ice to simply melt, goes into heating the water left behind.

And the rate of temperature increase, increases a lot.

Having all that ice there is good, or was good.


And on the other end of the spectrum, the movie about the ice age 2, Day After Tomorrow -
https://www.youtube.com/watch?v=Ku_IseK3xTc
 
U

Ununionized

Pictures mean nothing. The modern video era is rife with people presenting various naturally ocurring phenomena to claim

"The laws of fisicks has dun got Backerds!"

No, they haven't.

And the COLD NITROGEN BATH isn't a heater no matter how many

"importunt guvurmint fellurs with bow ties,
and thair names on thay's own parkin spot
down two the yewnuversatee,

told you it's one.

Just like pot wasn't like heroin when your grandpa was going around trumpeting that you were

"all gonna git hooked on thim opioids and heroin if we don't get off that devil weed and git on just opioids!"

Your pictures mean nothing. The laws of reality mean everything and reveal you a crass and obviously willfully ignorant preacher of fraud.

No nitrogen bath was, or ever will be, a heater.


the latest from the greenland ice sheet
last year had some impressive late year melting
this year is doing some impressive moves, pictures do speak for themselves
not a prediction for the year's melt, but should not be ignored
 

igrowone

Well-known member
Veteran
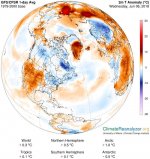
https://cci-reanalyzer.org/wx/DailySummary/#t2


https://earth.nullschool.net/#curre...hographic=-66.35,69.86,338/loc=-86.518,60.759


these both show temperatures below zero in the arctic and in greenland today...
weather is not climate but a result of it.
your claims are as bogus as ......astroturf!

here's the picture that i see from the link provided
which matches the current melting quite closely
edit: the upper link which is NOAA, didn't look at the 2nd one
 

Attachments

  • gfs_nh-sat1_t2anom_1-day.jpg
    gfs_nh-sat1_t2anom_1-day.jpg
    115 KB · Views: 10

Latest posts

Latest posts

Top