What's new
  • Happy Birthday ICMag! Been 20 years since Gypsy Nirvana created the forum! We are celebrating with a 4/20 Giveaway and by launching a new Patreon tier called "420club". You can read more here.
  • Important notice: ICMag's T.O.U. has been updated. Please review it here. For your convenience, it is also available in the main forum menu, under 'Quick Links"!

Have you looked at the North Pole lately?

M

moose eater

My wife, half-jokingly, half-seriously, has suggested that the sub-arctic may soon become North America's bread basket; probably the only reprieve our failing economy here might receive of any noteworthy amount in the future, from what is currently seen here..

Once upon a time, thousands of years ago, mastodon or mammoth (my confusion or lack of certainty, sorry) ate palm leaves where what was once referred to as the Village of Barrow and elsewhere in the arctic are.

Folks, for many years now, would 'tread current' in river boats, holding their position in the water, off/near banks that were deteriorating, in areas along the Yukon and other northern rivers, watching as river banks would collapse into the current, sometimes exposing ancient ivory tusks, then heading into the banks to extract the tusks.

Not an entirely safe prospect, as you can imagine the weight of silt or other banks caving in on a boat in current like that, and the possibility of it ending poorly, if persons aren't alert.

The related fossil ivory markets are gray to black; anything within high-water mark of navigable waterways is technically Federal turf.

But yeah, what has been cold for many centuries, was once a rich, tropical, region. Probably still harsh, but in different ways than what we have known.
 

Phaeton

Speed of Dark
Veteran
"rich and tropical" like Seattle is tropical. Still, it rarely dropped below freezing. Warm enough for Nanookasaurous Rex to eat Hadrosaurs up on the North Slope.
A lot of ten and twenty foot tusks showing up in cutbanks on the Porcupine River north of Fort Yukon.
And Everything is melting everywhere, it is so cool.
 
M

moose eater

It's been my understanding that there were 4-5 distinct periods of time involving dinosaurs in Alaska. They varied re. climate and moisture content. some of them involving what is now Alaska being predominantly covered by shallow salt water.

The dinos from those periods included herbivores, carnivores, sea-born, and some of their immediate descendants are still here today.

The burbot we fish for and still eat today, date back to the Pleistocene period.

There've been fossils of prehistoric inhabitant found up near Chicken (Little chicken Creek?) that are of distant direct-relations to horses, and other species.

It wasn't just one period or climate.

There was a bone found in a suburban setting, just a couple years back or so, behind Woodriver Elementary school, by a youngster walking home through the spruce stumps.

And fossils have been found in what is now the area of the Alaska Range.

The history back then covers multiple climates, and beasts.
 

trichrider

Kiss My Ring
Veteran
https://www.climate.gov/news-features/blogs/beyond-data/duct-tape-and-seesaws-climate-trends-101


Duct tape and seesaws: Climate trends 101


...Coda: Past performance does not guarantee future results...

Another criticism of the use of linear trends is that people can over-rely on their signal and just assume an extrapolation of current trends will play out in the future. That may be generally true for some very big, slow, predictable things, but the climate system, especially regionally, is complex and driven by many actors. That complexity means that especially on the regional level, future trends may be faster, slower—or wholly different—than the past.
Thanks for going Beyond the Data, to a land of see saws and duct tape.
 
M

moose eater

I'd say there's no doubt that climate change is occurring.

My best hunch is that humans have accelerated what might be otherwise normal cycles.

The changes, season-to-season, are varied, and not necessarily unidirectional in all places, if any.

The SW US I referenced earlier, is having what seems to be cooler winters, with hotter summers.

They've had both features in the past, but the frequency of both seem to be increasing, from my subjective observations.

Likewise, Interior Alaska (in particular, & as stated numerous times) is moderating in both winter and summer. Our summer months (specifically in the heart of the Interior) are more damp and cooler (the nearly 100 f days of 30-40 years ago, typically June or early July, were the extremes back then for summer), with summers now often being far more moderate, w/ few to no extremes near the mid-90s +.

Our once "Holy SHIT" season, which traditionally, in my time here, was from later December/early January through the middle of March, where we might see -60 to -70 f on an extreme series of days, is rarely seen at all here any more, and if we see -40 or so, it's for days, not a week or 3. (*Yes, I'm selfishly thankful).

As stated before, I envision how a pressure cooker works, as far as evaporation, condensation and the forces of heat/cooling.

I believe the equatorial zones are heating up, causing greater evaporation, within a semi-closed atmosphere. That moisture has to go somewhere, and the air currents (notable increases in wind storms as one feature) carrying the moisture to some point north or south where condensation can occur in cooler climates, is possibly related to increase moisture in places that were previously more dry, and decreased moisture in the equatorial areas.

I may be full of shit, but until I see something that disproves my loosely spun pressure-cooker model, that's how I see it.
 

igrowone

Well-known member
Veteran
big day in greenland

big day in greenland

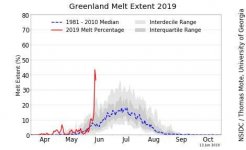
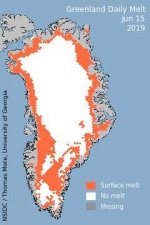
here's the image of when 2 billion tons of ice melt away from greenland in a day
and no, it's not normal
 

Attachments

  • 20170318 172152 800x600
    20170318 172152 800x600
    89.3 KB · Views: 29
  • greenland_daily_melt_plot_tmb.jpg
    greenland_daily_melt_plot_tmb.jpg
    16.5 KB · Views: 18

trichrider

Kiss My Ring
Veteran
I'd say there's no doubt that climate change is occurring.

My best hunch is that humans have accelerated what might be otherwise normal cycles.

The changes, season-to-season, are varied, and not necessarily unidirectional in all places, if any.

The SW US I referenced earlier, is having what seems to be cooler winters, with hotter summers.

They've had both features in the past, but the frequency of both seem to be increasing, from my subjective observations.

Likewise, Interior Alaska (in particular, & as stated numerous times) is moderating in both winter and summer. Our summer months (specifically in the heart of the Interior) are more damp and cooler (the nearly 100 f days of 30-40 years ago, typically June or early July, were the extremes back then for summer), with summers now often being far more moderate, w/ few to no extremes near the mid-90s +.

Our once "Holy SHIT" season, which traditionally, in my time here, was from later December/early January through the middle of March, where we might see -60 to -70 f on an extreme series of days, is rarely seen at all here any more, and if we see -40 or so, it's for days, not a week or 3. (*Yes, I'm selfishly thankful).

As stated before, I envision how a pressure cooker works, as far as evaporation, condensation and the forces of heat/cooling.

I believe the equatorial zones are heating up, causing greater evaporation, within a semi-closed atmosphere. That moisture has to go somewhere, and the air currents (notable increases in wind storms as one feature) carrying the moisture to some point north or south where condensation can occur in cooler climates, is possibly related to increase moisture in places that were previously more dry, and decreased moisture in the equatorial areas.

I may be full of shit, but until I see something that disproves my loosely spun pressure-cooker model, that's how I see it.
we may all well be.
i'm not endorsing your 'pressure cooker' analogy because of your description of a "semi-closed atmosphere", it's an elegant simplification though.
might you elaborate on what you call a "semi-closed atmosphere"?
the hot-cold part is easy enough to grasp, there must be equalization or it would be a runaway scenario, but leaving out the mechanism for the initial heating and subsequent convection and cooling (causing the winds?)that move the moisture around seems suspicious.
it certainly isn't CO2 causing the evaporation.


:chin:


https://climatereanalyzer.org/wx/DailySummary/#seaice-snowc-topo


daily climate re-analyzer doesn't jive with your graphic Igrowone
 
M

moose eater

Reports over the years of greater voids in the ozone layer, increased size of sheets of ice in inner space surrounding the planet, etc.

Gases, as they relate to warming, reminded me of the Low E Argon gas in my 'sealed' triple-pane windows, providing some amount of evidence that gases can magnify heat/radiation.

Mind you, per the reports of degraded ozone and increased ice in the inner space/outer atmosphere, my triple-pane windows appear to be more sealed than our atmosphere these days.
 

igrowone

Well-known member
Veteran
WOW!

WOW!

excitement on a Sunday
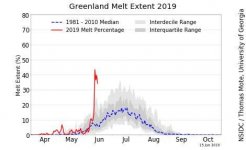
that melt spike up on the Greenland ice sheet?
well, it's persisting, 4 days i believe at this point
likely a record, this may be rather news worthy in the coming days
 

Attachments

  • greenland_daily_melt_tmb.jpg
    greenland_daily_melt_tmb.jpg
    15.7 KB · Views: 19
  • greenland_daily_melt_plot_tmb.jpg
    greenland_daily_melt_plot_tmb.jpg
    16.6 KB · Views: 20
F

Frylock

excitement on a Sunday
that melt spike up on the Greenland ice sheet?
well, it's persisting, 4 days i believe at this point
likely a record, this may be rather news worthy in the coming days

Why 'excitement'? Or is that sarcasm?
 

trichrider

Kiss My Ring
Veteran
April and May: Above average, but nothing to write Nome about

June 12, 2019


Surface melting on the Northern Hemisphere’s largest mass of ice began during the second week of April, with several significant melting episodes at the end of the month and into early May. Warm conditions over the ice sheet and winds from the east were prevalent for the two-month period. While significant, and above average for the 1981 to 2010 reference period, the melting extent has been comparable to previous years spanning 2010 to 2018.
Overview of conditions


Figure 1. This map shows the cumulative melt days for the 2019 melt season through May 31, 2019. Data are from the MEaSUREs Greenland Surface Melt Daily 25km EASE-Grid 2.0 data set. About the data

Credit: National Snow and Ice Data Center/Thomas Mote, University of Georgia
High-resolution image


Figure 2. The top plot shows Greenland’s daily melt extent with the percentage of the ice sheet experiencing melt for each day in 2019. The red line depicts April 1 to May 31, the dashed blue line the 1981 to 2010 average, and the grey areas show the range of 90 percent (pale grey) and 50 percent (dark grey) of all years during that period. The bottom plot shows daily melt areas in square kilometers from April 1 to May 31 for 2010 (black), 2011 (light green), 2012 (light orange), 2013 (lavender), 2014 (red), 2015 (purple), 2016 (brown), 2017 (dark orange), 2018 (dark green), and 2019 (blue). Data are from the MEaSUREs Greenland Surface Melt Daily 25km EASE-Grid 2.0 data set. About the data

Credit: National Snow and Ice Data Center/Thomas Mote, University of Georgia
High-resolution image


Figure 3. This map shows precipitation on April 12, spanning the North Atlantic, Arctic Ocean, and adjacent continental areas. This basic pattern recurred several times in late April and May.

Credit: NOAA, Climate Analyzer
High-resolution image

The number of surface melting days was well above the 1981 to 2010 average for the beginning of the 2019 Greenland melt season, particularly along the southeastern coast. Surface melting was detected up to 26 out of the 61 days between April 1 to May 31. A narrow band of melting was also present along the western coast, from the southern tip of Greenland to the region around Thule in the northwest, exceeding 20 days in some locations. This represents an early onset, but not an unprecedented extent or intensity relative to recent years.
On May 6, melt extent was the highest observed for that day in the 40-year satellite record by a small margin. However, greater melt events—both earlier and later than May 6—have been observed in the past. The May 6 event extended over the southeastern flank of the ice sheet.
More extensive melt periods were seen from mid- to late April and again in early May when clouds bringing warm air and moisture blanketed the southeastern coast. This was attributed to low pressure in the Irminger Sea, between Iceland and Greenland, driving air from the east and south onto the steeply sloping ice sheet, resulting in snowfall and sometimes rain.


http://nsidc.org/greenland-today/


:dunno:
 
Top