What's new
  • Happy Birthday ICMag! Been 20 years since Gypsy Nirvana created the forum! We are celebrating with a 4/20 Giveaway and by launching a new Patreon tier called "420club". You can read more here.
  • Important notice: ICMag's T.O.U. has been updated. Please review it here. For your convenience, it is also available in the main forum menu, under 'Quick Links"!

Have you looked at the North Pole lately?

trichrider

Kiss My Ring
Veteran
Russia plans to tow a nuclear power station to the Arctic. Critics dub it a 'floating Chernobyl'
By Mary Ilyushina, CNN
Updated 0241 GMT (1041 HKT) June 29, 2019

190626175935-arctic-nuclear-2-exlarge-169.jpg
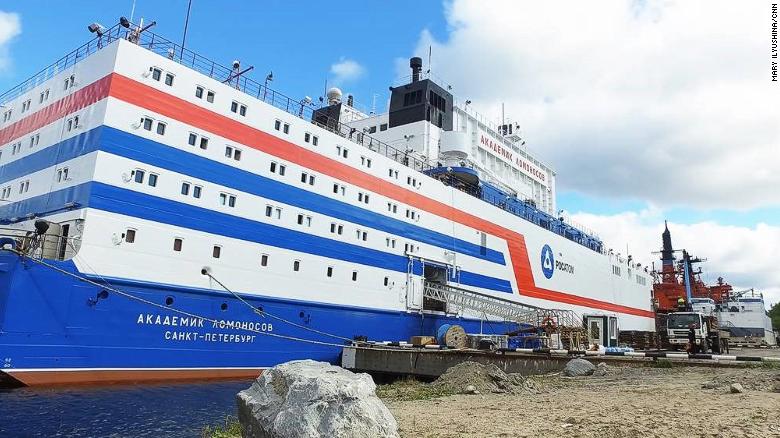
Akademik Lomonosov prepares to sail from Murmansk to Pevek in Russia's Far East.

Murmansk, Russia (CNN)Next month, a floating nuclear power plant called the Akademik Lomonosov will be towed via the Northern Sea Route to its final destination in the Far East, after almost two decades in construction.

It's part of Russia's ambition to bring electric power to a mineral-rich region. The 144-meter (472 feet) long platform painted in the colors of the Russian flag is going to float next to a small Arctic port town of Pevek, some 4,000 miles away from Moscow. It will supply electricity to settlements and companies extracting hydrocarbons and precious stones in the Chukotka region.
A larger agenda is at work too: aiding President Vladimir Putin's ambitious Arctic expansion plans, which have raised geopolitical concerns in the United States.

The Admiral Lomonosov will be the northernmost operating nuclear plant in the world, and it's key to plans to develop the region economically. About 2 million Russians reside near the Arctic coast in villages and towns similar to Pevek, settlements that are often reachable only by plane or ship, if the weather permits. But they generate as much as 20% of country's GDP and are key for Russian plans to tap into the hidden Arctic riches of oil and gas as Siberian reserves diminish.

In theory, floating nuclear power plants could help supply energy to remote areas without long-term commitments -- or requiring large investments into conventional power stations on mostly uninhabitable land.
But the concept of a nuclear reactor stationed in the Arctic Sea has drawn criticism from environmentalists. The Lomonosov platform was dubbed "Chernobyl on Ice" or "floating Chernobyl" by Greenpeace even before the public's revived interest in the 1986 catastrophe thanks in large part to the HBO TV series of the same name Rosatom, the state company in charge of Russia's nuclear projects, has been fighting against this nickname, saying such criticism is ill founded.
190626175512-arctic-2b-exlarge-169.jpg
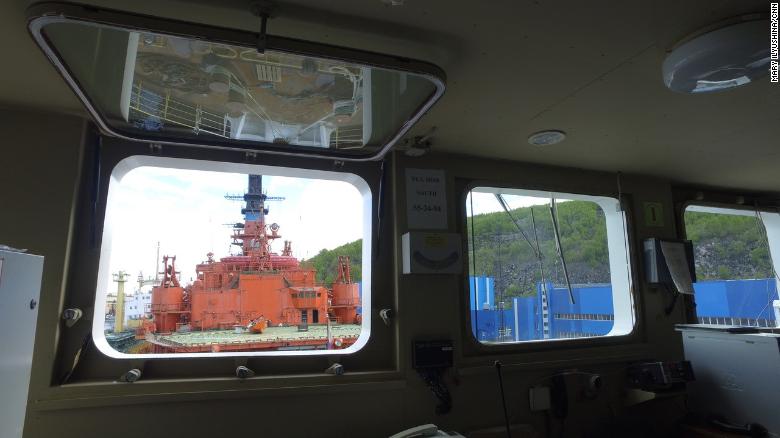
View outside of Akademik Lomonosov's main deck.

"It's totally not justified to compare these two projects. These are baseless claims, just the way the reactors themselves operate work is different," said Vladimir Iriminku, Lomonosov's chief engineer for environmental protection. "Of course, what happened in Chernobyl cannot happen again.... And as it's going to be stationed in the Arctic waters, it will be cooling down constantly, and there is no lack of cold water."


The idea itself is not new -- the US Army used a small nuclear reactor installed on a ship in the Panama Canal for almost a decade in the 1960s. For civil purposes, an American energy company PSE&G commissioned a floating plant to be stationed off the coast of New Jersey, but the project was halted in the 1970s due to public opposition and environmental concerns.


Russia's civilian nuclear industry also faced public questions following the Chernobyl catastrophe, which shaped concerns about "the peaceful atom" for decades to follow. Construction of dozens of nuclear plants stopped, affecting not only massive Chernobyl-scale projects but also slowing down the use of low-power reactors like the one in what would become the floating station (The Chernobyl plant produced up to 4,000 megawatts. Lomonosov has two reactors producing 35 megawatts each).
190626163119-arctic-3-exlarge-169.jpg
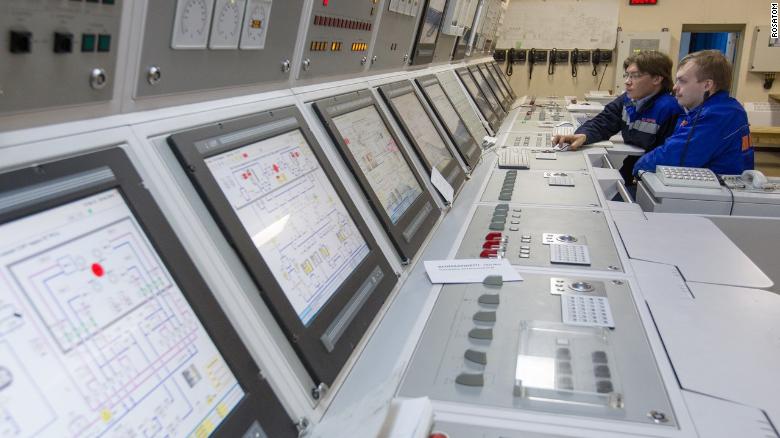
The control center of the Akademik Lomonosov floating nuclear platform.

"These reactors were initially to be used within city limits, but unfortunately the Chernobyl incident hindered that," said Iriminku. "Our citizens, especially if they are not technically savvy, don't really understand the nuclear energy and that these stations are built differently, so it's almost impossible to explain that to them."
The explosion at Chernobyl directly caused around 31 deaths, but millions of people were exposed to dangerous radiation levels.
The final death toll as a result of long-term radiation exposure is much disputed. Although the UN predicted up to 9,000 related cancer deaths back in 2005, Greenpeace later estimated up to 200,000 fatalities, taking further health problems connected to the disaster into account.


Modern Russia hasn't seen anything close to Chernobyl though. Russia, a major oil and gas producer, also operates several nuclear power stations. The state atomic energy corporation Rosatom has long maintained that its industrial record is one of reliability and safety, and that its reactors have been modernized and upgraded.


But rather than summoning the specter of Chernobyl, some nuclear watchdogs are drawing parallels to the 2011 accident at Fukushima in Japan, with the images of its waterlogged reactors still fresh in the public memory. The Russian plant's main benefits -- mobility and ability to work in remote regions -- complicate some crucial security procedures, from routine disposal of the nuclear fuel to rescue operations in the event the platform is hit by a massive wave.
190626163338-arctic-4-exlarge-169.jpg
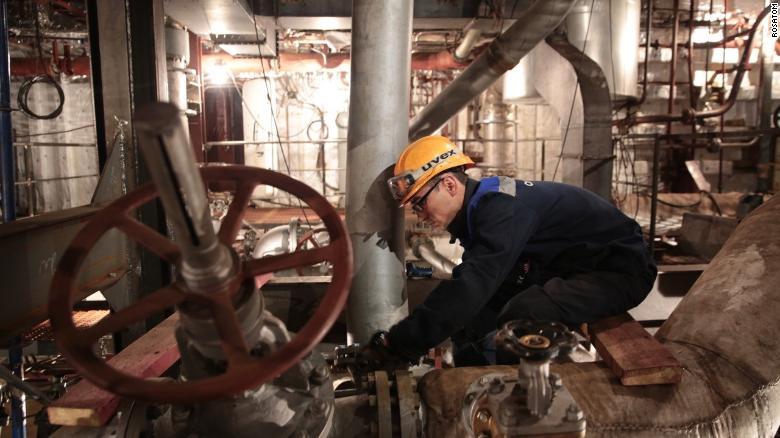
A worker finishes construction inside the platform's facilities.

But project engineers say they've learned the lessons of Fukushima.
"This rig can't be torn out of moorings, even with a 9-point tsunami, and we've even considered that if it does go inland, there is a backup system that can keep the reactor cooling for 24 hours without an electricity supply," said Dmitry Alekseenko, deputy director of the Lomonosov plant.


However, experts of Bellona, an NGO monitoring nuclear projects and environmental impacts, say 24 hours might not be enough to prevent a disaster should a tsunami land the rig among towns with two active nuclear reactors aboard.
190626163418-arctic-5-exlarge-169.jpg
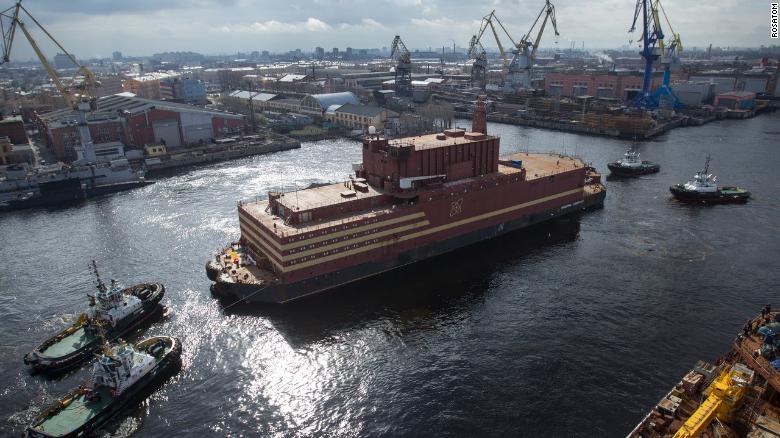
Akademik Lomonosov rests in St. Petersburg before it was brought to Murmansk to be filled with nuclear fuel.

And then there is the question of cost. Some Russian officials have questioned the floating reactor complex's price tag of an estimated $450 million, saying it would need to enter serial production to be economically viable. Rosatom has been working to attract clients from Asia, Africa and South America to purchase next iterations of Akademik Lomonosov, but has yet to announce any deals.


The last Russian nuclear project of a comparable scale was completed in 2007, when the "50 Years of Victory" nuclear-powered icebreaker finally sailed after sitting in the docks since 1989. Now, after more than 20 years of arguments, changes of contractors and economic crises, Russian engineers can finally take pride in launching the world's only nuclear floating rig.


https://edition.cnn.com/2019/06/28/...loating-nuclear-power-station-intl/index.html
 

trichrider

Kiss My Ring
Veteran
June 2019 ENSO Blog Update: Concentrate and ask again
Author:
Emily Becker
June 13, 2019

Our El Niño is still hanging around, and forecasters think it’s likely to stay through the summer. What happens after that is less clear, though, with about a 50% chance of El Niño continuing through the fall and winter.


Things as they are

The sea surface temperature across much of the tropical Pacific is still warmer than average, with the Niño3.4 Index coming in at 0.64°C above average during May (via ERSSTv5).
geopolar-ssta-monthly-nnvl--620x413--2019-05-00.png


May 2019 sea surface temperature departure from the 1981-2010 average. Image from Data Snapshots on Climate.gov; data from NOAA’s Environmental Visualization Lab.

The atmosphere also reflected weak El Niño during May, and both the Southern Oscillation Index the Equatorial Southern Oscillation Index were moderately negative. When these indexes are negative, it means the surface air pressure over the far western Pacific is higher than average (more sinking air) and the surface air pressure over the central-eastern Pacific is lower than average (more rising air), indicative of a weakened Walker circulation.

Things that were

Speaking of the Niño3.4 index—it’s been just bumping along between 0.5° and 1°C above average for several months in a row. This behavior is fairly unusual.
ERSST_Jan_thru_May_2019_620.png


Monthly sea surface temperature in the Niño 3.4 region of the tropical Pacific for 2018–19 (purple line) and all other El Niño years since 1950. Climate.gov graph based on ERSSTv5 temperature data.

Of the 23 El Niño winters in our historical record (dating back to 1950), nine persisted into March–May. Six of those were stronger El Niños, with the three-month-average Niño3.4 Index (the “Oceanic Niño Index” or ONI) peaking at 1.5°C or more above average.


Two winters, 1968–69 and 1986–87, featured a peak ONI of 1.1°C and 1.2°C (respectively) and persisted into the spring. Only once before now has the ONI remained above 0.5°C but less than 1°C above average throughout the winter and lasted into the spring: 2014–15. In that instance, March 2015 was technically the start of the great El Niño of 2015-16.


These three cases were all followed by El Niño the next winter. The predictive value of this factoid is not large, though, and I’m really just providing you fodder for your next very esoteric trivia night. You can revisit Tony’s excellent post from 2014 for an explanation of why past is not prologue, but essentially, the ocean/atmosphere system is so complex that from year to year, even if some elements (like the ONI) look the same, there are many, many other differences. These differences mean that conditions will develop differently, leading to unique futures. My favorite part of Tony’s post is that it would take approximately one trillion quintillion years for nature to repeat itself!


Hints of what’s to come

So what has more predictive power? To develop the most complete picture of how conditions in the tropical Pacific might develop over the next several months, ENSO forecasters study current conditions and dynamical and statistical computer models. (From the grimaces I sometimes see after forecasters consider the latest model runs, I suspect some of us consult soothsayers, as well…)
Near-term, one of the conditions we look at is how the winds near the surface of the tropical Pacific—the trade winds—are behaving. The trade winds normally blow steadily east-to-west, keeping warm water piled up near Indonesia. When they slow down, that warm water can begin to slide eastward under the surface—a downwelling Kelvin wave—transferring warmer waters to the east. This warm wave eventually rises to the surface, reinforcing the El Niño. Throughout most of May, the trade winds were weaker than average.
ENSO_Wind_Anomalies_U850_Jun1_620.png


Near-surface wind anomalies over the tropical Pacific (5°N-5°S) during 2018, starting at the top in December 2018 and ending in early June 2019 at the bottom. Each row in this type of image is the departure from average (1981-2010) at that time. Pink areas show weaker-than-average trade winds, and green stronger. NOAA Climate.gov image, based on data provided by the Climate Prediction Center.

The effect of these weaker winds can be seen in the recent increase of warmer-than-average water under the surface of the tropical Pacific, as a new downwelling Kelvin wave has formed. (But not a Kelvin wave of cinematic proportions.)
Picture1_0.png


Area-averaged upper-ocean temperature anomaly (°C) in the equatorial Pacific (5°N-5°S, 180º-100ºW). The anomaly is computed as the departure from the 1981-2010 base period pentad (5-day) means. Upper ocean temperature anomalies were nearly average at the start of May, but anomalies increased toward the end of the month in association with a downwelling Kelvin wave. CPC figure.

Over the next few months, this Kelvin wave will likely (66% chance!) supply the surface with the warmer-than-average water required to continue El Niño through the summer. Since the end of May, the trade winds have strengthened, mostly due to an active Madden-Julian Oscillation. The MJO has been distracting the tropical Pacific before and during this El Niño, providing “subseasonal variability” (changes in the atmospheric pattern on timescales of weeks).


For an idea of the longer term, we can look to computer models. Overall, the models in the current forecast predict that the Niño3.4 Index will stay near to slightly above the El Niño threshold of 0.5°C warmer than average. Some models are in the ENSO-neutral range, around average. It’s interesting that nearly all of the models remain between 0.0 and +1.0°C through the fall and into the winter; this level of agreement between the models would usually contribute to more confidence in the forecast. However, the mix of predictions above and below the El Niño threshold means that, while El Niño is the favorite for next winter, forecasters are giving it only a 50% chance at this point.
Stay with us while we surf the Kelvin waves and sail the trade winds, and we’ll keep you updated on all things ENSO!


https://www.climate.gov/news-featur...19-enso-blog-update-concentrate-and-ask-again


:ying:
 
M

moose eater

Phatty, yep, we now cook more than not -every- summer. The fires aren't new, but we're often seeing them in months/parts of seasons we never saw them before, and lasting later into the seasons.

I've had plans for fabrication for a dampered (at the ~6"+ inlet to the house), 4-channeled box on the outside of the house at the HRV intake, that would take 2"x24"x24" panels, from the side, with piano hinged, and foam-sealed door, for (in order of air passing through from outside) first, 1/4" hardware cloth, then no-seeum-size nylon or stainless bug screen, then Merv 8 pleated filter, then (not perpetually in place, but during fires) 2" VOC-grade carbon.

The external, post-filtering dampering would make up for the fact that my newer (12-15 years ago) HRV 'wants' 7" to 8" ducting, and we first ran another make, that functioned fine with 6", so I get limited back-pressuring inside the unit, and the exterior damper on the intake side, outside the home and unit, would help to alleviate that. The carbon would allow fresh air intake sans the frigging smoke.

------------------------------

Trich, the folks involved in littering the Pacific, Bering, and Beaufort Seas, etc., have, for many years, not cared what they put in there. They've scuttled nerve agents decades ago, chemical agents, old ships, and more. The Fukushima disaster now has measurable increases in Cesium35 off Alaska's west coast..

While the Bering is a relatively shallow body of water, in contrast to others, imagine enough radioactive materials to measure increases in such things... And we, to include my family, have regarded salmon, and other sources, as 'safe and healthy' food.

How many advanced species defile their own nests?

I could go on with stories about the military testing, and/or discarding barrels of 'unknown substances,' later found near the Little Gerstle and Gerstle Rivers, near the confluence with the Johnson River, reported to the CID/MPs at Ft. Greely when I was a contractor there, or testing of artillery shells, bearing nerve of other agents, and other delivery methods, in days of old, out near the Village of Dot lake, and elsewhere too.

Recently they were unable to put firefighters on the ground at the Oregon Lakes Fire, due to unexploded ordinance there making it too unsafe for crews to be boots on ground..

And our more powerful governments are largely immune from prosecution for their crimes under environmental law. Hell, they donated The Presidio to be a public park after they'd contaminated it, with it later becoming a Super Fund site!!

If I toss a Dixie cup out the window, (processed paper and wax, with some ink), and a cop sees me, I can score a hefty fine.
 

trichrider

Kiss My Ring
Veteran
moose,

i know about those things.
grew up near the Pueblo Army Depot where they disposed of nerve agents.
older brother was security there and contracted some strange disease that they couldn't figure out, he eventually perished of it. he told me stories of the gov. malfeasance.


i've posted about the ENSO, PDO, el nino/la nina above for clarification why those forests are so dry...dry warm air transported over land. forest fires are not from pollution (maybe partly so, if you consider the chemtrails depositing aluminum and other chemicals), not from CO2...most are natural (lightening) and some are man-made (especially where environmentalists have stopped forest management practices...aka commiefornia).


be well
 
M

moose eater

Thanks. I'll take a peek at the link, now that I can, in a bit.

A friend who was an operating engineer, recalled a time at one of our local military installations here. They were excavating near the runway years ago. Another operator unearthed a stratified line of 'whitish layering' in the dirt, and immediately became ill.

Navy Beach, on Kodiak Island, behind Boy Scout Lake (where I lived part of the winter of '78/'79, briefly, in various abandoned WWII bunkers and military structures), at the end of WWII, the military took everything they weren't packing with them when they left, and pushed it with dozers into the small rock bay there. I've eaten mussels from the rocks there that winter, and my uncle was stationed there briefly during WWII.

South of there about ~25 miles, ~28 miles from Kodiak town-site, at Old Woman's Bay, we gathered cockles and butter clams from atop the sand for Christmas or New Years grub (good stuff, cooked atop a wood stove in the back of a cube can); hippies who were destitute and living in WWII bunkers at the aforementioned location, celebrating Christmas and New Years the best we could.

1986 late winter/spring, I was in Dillingham, getting ready to go to work, and NPR/Alaska Public Radio ran a story stating there was no sea life (plant or shell-fish) living in Old Woman's Bay 6-7 years after we'd eaten from that place.
----------------------------
Yes, the fires here are primarily caused by prolific lightning strikes; more in Alaska than most other places further from the poles. I believe due to conductivity re. geographic location and atmosphere. They study it here for that reason, as an adjunct project relative to HAARP years ago.

Contrary to Nick Begich's book and conspiracy theories, I know the head engineer there, who has worked there many years, off and on, through various managing/owning entities, and studied lightning in the area as a part of that work.

The State felonized starting any human-generated fire, accidental or not, when my neighborhood I now live in, burned heavily back in the early 80s, during the Bonanza Creek fire, which started very near to my current property, as a result of a smoldering wood chip fire, poorly tended, and dry tinder in the woods. Numerous cabins lost in that fire.. The trigger point for the felony was value loss of greater than 'X.' Can't recall the amount.

However, as you might imagine, they've been selective in who gets charged, and who doesn't. A former Colonel who owned the Tamarac Inn, 6 miles south of Nenana, in an area where very few persons had home-owners insurance due to non-conventional structures, absence of formal fire protection, etc. was responsible for the fire that burned MANY folks out there. Some structures still haven't been rebuilt or repaired LONG (many years) after that fire.

The Colonel and his wife were never charged. Though some folks went to jail and/or were warned sternly for threatening the Col. and his wife with retaliation for ruining their lives there. One of the 2 dumped a burn barrel with hot embers/ashes into the woods behind their property, while the woods were dry as a popcorn fart.

My suspicion is that he said his wife did it, because if convicted of a felony, a retired military officer can lose their pension. Convenient..
 

St. Phatty

Active member
I was looking at a map of Alaska.

Hess Creek, Shovel Creek, Nugget Creek. & Swan Lake.


I would guess they sound familiar to Alaska folks.
 
M

moose eater

Hess Creek, where it runs further north from the area you're looking at, was the site of an infamous raid on a HUGE (industrial-sized) squatter's greenhouse in the later 70s, that incorporates many a hilarious moment/story, with a person 'crop-sitting' (a some what unnerved alcoholic fellow in particular), at the time the chopper arrived, with that fellow hiding behind a tree. Riley. he's deceased now. Hilarious shit. Truly.

The rest of the area you referenced has two specific subdivisions within that area that are currently under evac orders for the fire raging there; the Shovel Creek Fire.

We're raining here in the larger area pretty good today, so the flames might get cooled down a tad, but the thing was growing pretty steadily since last week or so.

In the end there's a potential for them to evacuate up to 6 subdivisions in that general area.

Packing up valuables, critters, stash, or what have you. No fun for anyone caught in that bind.

When the Miller's Reach fire went through north of Wasilla, up near Big Lake and Houston, a number of years ago, I talked with a State cop I knew back then, who claimed that they drove down some subdivision roads where the walls of many homes had been burned away sufficiently to see specifics of remnants inside. He claimed there were some of those roads that appeared to have every other home as a grow.

But when you gotta' go, you gotta' go.. ;^>)
 

St. Phatty

Active member
Is Nugget Creek named for gold nuggets ?

Does anybody know of a good separation table for gold flour, the tiny stuff ?

There's a lot of contraptions advertised,
+++++++++++++++++++++++++++++++++++++
that make a lot of claims. The only ones I know that work are at a Swedish mine in Bjorkdahl, that is a leader in clean mining.++++++++++++++++


+ <== from my cat leaning on the keyboard.
 

igrowone

Well-known member
Veteran
Is Nugget Creek named for gold nuggets ? Or maybe, Pot Nuggets ? :woohoo:

Does anybody know of a good separation table for gold flour, the tiny stuff ?

There's a lot of contraptions advertised,
+++++++++++++++++++++++++++++++++++++
that make a lot of claims. The only ones I know that work are at a Swedish mine in Bjorkdahl, that is a leader in clean mining.++++++++++++++++


+ <== from my cat leaning on the keyboard.

i believe you may be talking about a Miller table
made from an old fashioned slate chalk board
 

igrowone

Well-known member
Veteran
new record, the nsidc statement speaks for itself

Between June 11 and 20, an extensive area of the Greenland ice sheet surface melted. At its peak on June 12, thawing climbed from the western and eastern coasts to elevations above 3,000 meters (9,800 feet). High air pressure and clockwise circulation around the island brought warm air from the south and sunny conditions. While several recent years have had similar early widespread melt events, the event of June 11 to 20 reached a peak of just over 700,000 square kilometers (270,000 square miles), setting a record for this early in the melt season. Models estimate the amount of melted ice at approximately 80 billion tons for that period.
 

Attachments

  • greenland_daily_melt_tmb.jpg
    greenland_daily_melt_tmb.jpg
    14.5 KB · Views: 8
  • greenland_daily_melt_plot_tmb.jpg
    greenland_daily_melt_plot_tmb.jpg
    16.8 KB · Views: 19
M

moose eater

I watched the bulk of the video you posted, trich.

Tried to dent my own pre-conceived notions and beliefs, based on my own programming; both what I've seen in person, and recall here for the last 42 years, in the sub-arctic, and balance both sides of the argument in my own mind.

I think I followed an argument that went something along the lines that if we pursue carbon dioxide reductions in the ways we're talking about, that plant life will suffer, and then we will suffer as a result. Did I follow that part correctly?

I think about that, versus the over-growth of 'dying lakes,' etc., that I see, implying both routine evolution of bodies of water, but certainly a thriving level of CO2.

My thought is that there has to be a balance in there, where the CO2 producers and the CO2 consumers benefit each other without tipping the scales.

I'm not a scientist. If I was, the first decade of growing incredible weed wouldn't have been as affected the next decade by the new well's water and changing amendment quality. Instead, I'm just an opinionated old codger who tries to look at what's in front of me; not that I haven't been wrong or been fooled a time or 3.

I don't know for sure, but 'believe' we've had an affect on the warming, climate change, what-have-you, that it is accelerated beyond what might've been normal, had we not pissed in our own troughs/nests.

I understand a bit, re. concerns of fixing the wrong variable. expense, energy, etc. and some well-intended 'fixes' might carry consequences of their own. There's thousands (or more) examples of this in our history.

The balancing or cynical conclusion for me is a cartoon I saved to my hard-drive a few years ago. Maybe someone sent it to me? It has folks sitting in an auditorium, looking at a large screen, and someone giving a presentation on warming and climate change.

The punch line in the thing is a character in the audience, asking the presenter on stage, "What if we're wrong, and we make a better more sustainable place all for nothing?"

I'm paraphrasing that, but that's what I'm left with.

And I'm a bit of a hypocrite too, as are most humans in their own unique or not-so-unique ways. I don't recycle all that I could.

On rare occasion, I buy plastic bottles of beverages in town to drink on the run, knowing the planet is steeped in the empty containers, now forming Islands in the oceans, etc.

And, unlike my wife, who despises the plastic bag phenomenon, and carries her own reusable grocery bags to the store, I don't own anything short of smaller back-packs, which are more or less forbidden, as they're viewed as facilitating shoplifting.

Anyway, your post was worthy of a reply. Sorry it was a day or 2 late.

And now I need to get back to my soilless mix conundrum, where I'm utilizing overly-mined ancient peat from bogs that date back 100's of thousands of years, to grow reefer, to help myself (and others) feel better about life. While indirectly paying some 2nd or 3rd world peasant poverty wages to climb seabird shit pinnacles on the coast some place, or go into caves, to retrieve bat guano.

It's a MAD, MAD world, eh?
 
M

moose eater

80 billion tons of ice? that would cool a hell of a lot of beer...:biggrin:

Some of our corporatist politicos used to fly glacial ice to D.C. for their fund-raisers and parties. Nothing like efficiency and conservation.. Using 1,000's of years old ice to mix a prehistoric martini.

Sometimes I think we really -do- deserve what we get.:tiphat:
 

trichrider

Kiss My Ring
Veteran
https://arxiv.org/pdf/1907.00165.pdf


NO EXPERIMENTAL EVIDENCE FOR THE SIGNIFICANT ANTHROPOGENIC CLIMATE CHANGE

J. KAUPPINEN AND P. MALMI
Abstract.
In this paper we will prove that GCM-models used in IPCC reportAR5 fail to calculate the influences of the low cloud cover changes on the global temperature. That is why those models give a very small natural temperature change leaving a very large change for the contribution of the green-house gases in the observed temperature.

This is the reason why IPCC has to use a very large sensitivity to compensate a too small natural component. Further, they have to leave out the strong negative feedback due to the clouds in order to magnify the sensitivity.

In addition, this paper proves that the changes in the low cloud cover fraction practically control the global temperature.


1.Introduction
The climate sensitivity has an extremely large uncertainty in the scientific literature. The smallest values estimated are very close to zero while the highest ones are even 9 degrees Celsius for a doubling of CO2. The majority of the papers are using theoretical general circulation models (GCM) for the estimation. These models give very big sensitivities with a very large uncertainty range. Typically, sensitivity values are between 2–5 degrees. IPCC uses these papers to estimate the global temperature anomalies and the climate sensitivity. However, there area lot of papers, where sensitivities lower than one degree are estimated without using GCM. The basic problem is still a missing experimental evidence of the climate sensitivity. One of the authors (JK) worked as an expert reviewer of IPCCAR5 report. One of his comments concerned the missing experimental evidence for the very large sensitivity presented in the report [1]. As a response to the comment, IPCC claims that an observational evidence exists for example in Technical Summary of the report.

In this paper we will study the case carefully.

2.Low cloud cover controls practically the global temperature. The basic task is to divide the observed global temperature anomaly into two parts: the natural component and the part due to the green house gases. In order to study the response we have to represent Figure TS.12 from Technical Summary of IPCC AR5 report (1).

This figure is Figure 1. Here we highlight the subfigure“Land and ocean surface” in Figure 1. Only the black curve is an observed temperature anomaly in that figure. The red and blue envelopes are computed using climate models. We do not consider computational results as experimental evidence. Especially the results obtained by climate models are questionable because the results are conflicting with each other.....


....Conclusion


We have proven that the GCM-models used in IPCC report AR5 cannot compute correctly the natural component included in the observed global temperature. The reason is that the models fail to derive the influences of low cloud cover fraction on the global temperature. A too small natural component results in a too large portion for the contribution of the greenhouse gases like carbon dioxide. That is why IPCC represents the climate sensitivity more than one order of magnitude larger than our sensitivity 0.24°C. Because the anthro-pogenic portion in the increased CO2 is less than 10 %, we have practically no anthro-pogenic climate change. The low clouds control mainly the global temperature.


paper and graphs here: https://arxiv.org/pdf/1907.00165.pdf


Spotty coverage: Climate models underestimate cooling effect of daily cloud cycle

Morgan Kelly, Princeton Environmental Institute
Jan. 10, 2018 10:32 a.m.

Princeton University researchers have found that the climate models scientists use to project future conditions on our planet underestimate the cooling effect that clouds have on a daily — and even hourly — basis, particularly over land.

The researchers report in the journal Nature Communications that models tend to factor in too much of the sun’s daily heat, which results in warmer, drier conditions than might actually occur. The researchers found that inaccuracies in accounting for the diurnal, or daily, cloud cycle did not seem to invalidate climate projections, but they did increase the margin of error for a crucial tool scientists use to understand how climate change will affect us.

“It’s important to get the right result for the right reason,” said corresponding author Amilcare Porporato, a professor of civil and environmental engineering and the Princeton Environmental Institute. “These errors can trickle down into other changes, such as projecting fewer and weaker storms. We hope that our results are useful for improving how clouds are modeled, which would improve the calibration of climate models and make the results much more reliable.”

Porporato and first author Jun Yin, a postdoctoral research associate in civil and environmental engineering, found that not accurately capturing the daily cloud cycle has models showing the sun bombarding Earth with an extra one or two watts of energy per square meter. The increased carbon dioxide in the atmosphere since the start of the Industrial Age is estimated to produce an extra 3.7 watts of energy per square meter. “The error here is half of that, so in that sense it becomes substantial,” Porporato said.

Yin and Porporato undertook their study after attending a seminar on cloud coverage and climate sensitivity. “The speaker talked a lot about where the clouds are, but not when,” Yin said. “We thought the timing was just as important and we were surprised to find there were fewer studies on that.”

Clouds change from hour to hour and from day to day. Climate models do a good job of capturing the average cloud coverage, Yin said, but they miss important peaks in actual cloud coverage. These peaks can have a dramatic effect on daily conditions, such as in the early afternoon during the hottest part of the day.
“Climate scientists have the clouds, but they miss the timing,” Porporato said. “There’s a strong sensitivity between the daily cloud cycle and temperature. It’s like a person putting on a blanket at night or using a parasol during the day. If you miss that, it makes a huge difference.”
ic

The researchers used both reanalysis data and satellite images from 1986-2005 to calculate the average diurnal cycles of clouds in each season worldwide. The reanalysis (above) shows (left to right) the mean (average), standard deviation (amplitude) and phase (timing) of global cloud coverage by season. The color scale indicates low (blue) to high (red) coverage, amplitude and timing. Most previous models suggest that clouds are thickest over land in the early morning, but the Princeton study showed that cloud coverage peaks more frequently in the afternoon.

Image by Jun Yin, Department of Civil and Environmental Engineering

The researchers used satellite images from 1986-2005 to calculate the average diurnal cycles of clouds in each season worldwide. Yin analyzed the cloud coverage at three-hour intervals, looking at more than 6,000 points on the globe measuring 175 miles by 175 miles each.

Yin and Porporato compared the averages they came up with to those from nine climate models used by climate scientists. The majority of models have the thickest coverage occurring in the morning over the land, rather than in the early afternoon when clouds shield the Earth from the sun’s most intense heat. “A small difference in timing can have a big radiative impact,” Yin said.


The researchers plan to explore the effect different types of clouds have on climate-model projections, as well as how cloud cycles influence the year-to-year variation of Earth’s temperature, especially in relation to extreme rainfall.

Gabriel Katul, professor of hydrology and micro-meteorology at Duke University, said that “the significance is quite high” of accurately modeling the daily cloud cycle. Katul was not involved in the research but is familiar with it.

The cloud cycle can indicate deficiencies in the characterization of surface heating and atmospheric water vapor, both of which are necessary for cloud formation, he said. Both factors also govern how the lowest portion of Earth’s atmosphere — known as the atmospheric boundary layer — interacts with the planet’s surface.

“The modeling of boundary-layer growth and collapse is fraught with difficulties because it involves complex processes that must be overly simplified in climate models,” Katul said. “So, exploring the timing of cloud formation and cloud thickness is significant at the diurnal scale precisely because those timescales are the most relevant to boundary-layer dynamics and surface-atmosphere heat and water-vapor exchange.”

When it comes to clouds, climate models have typically focused on mechanisms, spatial areas and timescales — such as air pollution and microphysics, hundreds of square kilometers, and seasons, respectively — that are larger and more generalized, Katul said. “There are practical reasons why data-model comparisons were conducted in a manner that masked the diurnal variation in clouds,” he said. “Diurnal variation was somewhat masked by the fact that much of the climate-model performance was reported over longer-term and larger-scale averages.”

By capturing the timing and thickness of the daily cloud cycle on a global scale, however, Yin and Porporato have provided scientists with a tool for confirming if climate models aptly portray cloud formation and the interaction between clouds and the atmosphere.

“The global coverage and emphasis on both ‘timing’ and ‘amount’ are notable. As far as I am aware, this is the first study to explore this manifold of models in such a coherent way,” Katul said. “I am sure this type of work will offer new perspectives to improve the representation of clouds. I would not be surprised to see this paper highly cited in future IPCC [U.N. Intergovernmental Panel on Climate Change] reports.”

The paper, “Diurnal cloud cycle biases in climate models,” was published online Dec. 22 by Nature Communications. The work was supported by the U.S. Department of Agriculture’s Agricultural Research Service (no. 58-6408-3-027); the National Science Foundation (grant nos. EAR-1331846, EAR-1316258 and EAR-1338694); and the Duke University Wireless Intelligent Sensor Networks (WISeNet) program (grant no. DGE-1068871).


https://www.princeton.edu/news/2018...nderestimate-cooling-effect-daily-cloud-cycle
 

trichrider

Kiss My Ring
Veteran
Arctic fox astounds scientists by trekking 2,176 miles in 76 days — from Norway to Canada

By Theresa Braine
| New York Daily News |
Jul 01, 2019 | 8:51 PM
SW6FIPZIWNGWTHYBD5VXQJ3EUM.jpg

An Arctic fox like this one is getting attention for traveling a great distance in a short period of time. (Education Images/Universal Images Group via Getty)

Logging nearly 30 miles per day, an Arctic fox has trekked from the Svalbard Islands in Norway to Inuit territory in the northern reaches of Canada, astounding scientists.


That’s 2,176 miles in 76 days, reported BBC News.

The young female had been tracked via a GPS device installed by researchers at the Polar Institute in Norway, releasing her into the wild in March 2018, BBC News said.

Twenty-one days later she had reached Greenland, BBC News said, about 940 miles from her starting point. A mere 76 days after she left Svalbard, the fox was found on Ellesmere Island in Nunavut, Canada.

Her speed across the Greenland ice sheets was especially noteworthy, reported Australian news network ABC. The fox trotted 96 miles a day across that country, according to the findings, which were published in the Polar Research Journal.

At 1.4 times speedier than the pace of an adult male Arctic fox tracked in Alaska, this fox logged the “fastest movement rate ever recorded for this species,” the report said.

The Arctic fox is a fluffy, white, dark-eyed creature weighing between 6.5 and 17 pounds, according to National Geographic. Its head and body can run from 18 to 26.75 inches, its tail to 13.75.

Their round, compact bodies not only make them resemble compact wads of fur but also give them less surface area, meaning less exposure to their cold habitat’s temperatures, according to Defenders of Wildlife. The same goes for their short muzzles, ears and legs, combined with their thick, deep fur — including on their paws, which enables them to walk on snow and ice, Defenders of Wildlife says.

Even with all that insulation and adaptation, this fox had moxie.

While the Arctic fox tends to migrate in the winter to forage, this one had gone way beyond the norm, “crossing extensive stretches of sea ice and glaciers,” the Norwegian Polar Institute’s Eva Fuglei told New Scientist.

“We couldn’t believe our eyes at first,” study co-author Fuglei told Norwegian public broadcaster NRK, according to BBC News. “We thought perhaps it was dead, or had been carried there on a boat, but there were no boats in the area. We were quite thunderstruck.”


https://www.nydailynews.com/news/wo...0190702-mxur6otdxjep5pvavclyvppf3i-story.html


must have swum part of the way huh?
 

armedoldhippy

Well-known member
Veteran

St. Phatty

Active member
3 to 4 feet of hail, lol. heavy equipment to clear the roads, & ice sliding down streets pushing cars like mudslides do. seems normal to me... had 4 1/2 inches of rain in an hour nearby the other day. cut blacktop roads etc . nope, nothing unusual about any of this.:biggrin:

I'm 61 and heavy hailstorms have been happening all of my life.

I've never been somewhere where they had enough hail to snowboard on.

This is one news items that I remember in both paper and electronic media.

I don't think it's a new thing - and I don't see a trend - in that category.


Now, what Moose Eater is saying about Alaska, that is also described in the news media - that is scary & significant change.


The part about news reporting of scientific events - see that part -

"Without swift action on climate change, heat waves could kill thousands in U.S. cities"

/\ scary headline, left wing version of Alex Jones scary headline ?

Actually, that happened in Europe in 2003.

"The 2003 European heat wave led to the hottest summer on record in Europe since at least 1540"

https://en.wikipedia.org/wiki/2003_European_heat_wave


I think it's a mistake when NBC News tries to mix a routine weather news item about hail, with reporting on Climate Change.
 
Top