What's new
  • Happy Birthday ICMag! Been 20 years since Gypsy Nirvana created the forum! We are celebrating with a 4/20 Giveaway and by launching a new Patreon tier called "420club". You can read more here.
  • Important notice: ICMag's T.O.U. has been updated. Please review it here. For your convenience, it is also available in the main forum menu, under 'Quick Links"!

Have you looked at the North Pole lately?

St. Phatty

Active member
Yeah - what happened to winter? - over here in London U.K. its mid-winter, and we are not getting the freezing temperatures and snow/ice we used to get when I was a lad hardly at all - down here in the south of England right now (and for the past few years) - the weather is more like an extended autumn - or an early spring at this time of year - its confusing the heck out of the trees, plants and shrubs etc -

It may be a safe bet to expect an early spring.

In Southern Oregon it's not quite as cold as usual. Haven't had to run a heater in the well house, which is something I do when it's in the teens in degrees F.

Rain is running a little less than half of usual amount. Enough to replenish the well.
 

trichrider

Kiss My Ring
Veteran
Solar Effects on the Atmospheric Electric Field During 2010–2015 at Low Latitudes

J. Tacza
J.‐P. Raulin
R. R. S. Mendonca
V. S. Makhmutov
A. Marun
G. Fernandez


First published: 23 October 2018
https://doi.org/10.1029/2018JD029121

Read the full text

PDF
Tools
Share


Abstract

Solar phenomena such as flares and solar energetic particles events are potential candidates to affect the global atmospheric electric circuit. One can study these effects using measurements of the atmospheric electric field in fair weather regions. In this paper, we investigate deviations of the atmospheric electric field daily curve during solar disturbances (solar flares and solar proton events) from mean values obtained in fair weather conditions. Using the superposed epoch analysis, in order to enhance the visualization of small effects, we study the atmospheric electric field data observed between January 2010 and December 2015 at the Complejo Astronómico El Leoncito, San Juan, Argentina. The results show no deviation of the atmospheric electric field after solar flares, and an increase of about 10 V/m after solar proton events. The last result suggests possible ionization effects above thunderstorm in disturbed weather regions, which alters the global atmospheric electric circuit. On the other hand, we analyze the variation of the atmospheric electric field during a ground level enhancement on 17 May 2012, which was capable to produce changes on the surface electric field.


Transition Probabilities of Noise-induced Transitions of the Atlantic Ocean Circulation


Scientific Reports volume 9, Article number: 20284 (2019) Cite this article


Abstract

The Atlantic Meridional Overturning Circulation (AMOC) is considered to be a tipping element of the climate system. As it cannot be excluded that the AMOC is in a multiple regime, transitions can occur due to atmospheric noise between the present-day state and a weaker AMOC state. For the first time, we here determine estimates of the transition probability of noise-induced transitions of the AMOC, within a certain time period, using a methodology from large deviation theory. We find that there are two types of transitions, with a partial or full collapse of the AMOC, having different transition probabilities. For the present-day state, we estimate the transition probability of the partial collapse over the next 100 years to be about 15%, with a high sensitivity of this probability to the surface freshwater noise amplitude.


Introduction

The Atlantic Ocean circulation has a special role in the climate system, because its associated meridional heat transport is positive over all latitudes1, peaking at about 1.5 PW at 26.5°N2. Responsible for this heat transport is the Atlantic Meridional Overturning Circulation (AMOC) which is the zonally integrated volume transport generated by a complex system of Atlantic Ocean currents. Over the period 2008–2012 the mean AMOC strength at 26.5°N decreased by about 2.7 Sv compared to the period 2004–2008, when it was about 17.5 Sv. There were also short intervals (e.g. at the end of 2009) where the AMOC strength was nearly zero3.
There is convincing evidence, both from observations and model results, that the strength of the AMOC is sensitive to the surface freshwater forcing4,5. About sixty years ago, this sensitivity was already studied in an idealized box model6 and it was shown that the dependence of the AMOC strength on both temperature and salinity (through the density) can lead to a multiple equilibria regime. In so-called Earth system Models of Intermediate Complexity (EMICs), such regimes have been detected through hysteresis behaviour of the AMOC once the surface freshwater strength is varied7. The multiple equilibria regime is then bounded by relatively sharp transitions between a strong and weak AMOC state.
Although such hysteresis behaviour has also been found8 in relatively low-resolution Global Climate Models (GCMs), the computations to detect multiple equilibria regimes in state-of-the-art GCMs are demanding and have not been carried out systematically. Nevertheless, the AMOC is listed among the ‘tipping elements’ of the Earth system9, because it can not be excluded that the present-day climate state is in a multiple equilibria regime. For this reason, EMICs have been used to develop indicators of the multiple equilibria AMOC regime, that can be easily computed from model results and the sparse instrumental record.
Following initial ideas by Rahmstorf10 and de Vries and Weber11, a well-known indicator is based on the AMOC-induced freshwater divergence in the Atlantic, referred to as ∑ in12, later reintroduced as ΔMov by Liu et al.13,14. The component at the southern boundary of the Atlantic (at 35°S) is much larger than the northern component (at 65°N) and is often referred to as Mov11,15 (or Fov8). A negative (positive) value of Mov indicates that the AMOC is in a multiple (single) equilibria regime. Mov was developed from ocean-only model results and hence neglects the effects of atmospheric feedbacks16. However, it has been widely used in models to interpret the behaviour of the AMOC17,18. Present-day observational results show that Mov is in the range of −0.35 Sv to −0.1 Sv13,15,19,20. Hence, if Mov is indeed a proper indicator, then the present-day AMOC is in a multiple equilibria regime.
In this case, a change in the surface freshwater forcing can induce a transition to a (weak) AMOC state, often referred to as bifurcation tipping. In addition, a relatively large perturbation in any observable may also induce such a transition, often referred to as noise-induced tipping. Indeed, paleoclimate studies have shown that abrupt changes in atmospheric temperatures associated with the Dansgaard-Oeschger cycles, which are thought to be closely related to changes in AMOC strength, may have been noise-induced21,22. However, to determine the probability of an AMOC transition within a certain period of time (e.g. into the future), for example due to noise in the surface freshwater forcing, is a difficult problem which has not been addressed yet.
Here, using techniques from large-deviation theory23, we present results for the transition probabilities of noise-induced changes in the AMOC. As such techniques are still computationally demanding, we apply them here to a detailed box model of the AMOC, in which the value of Mov is a precise measure of the multiple equilibria regime17. By using Mov, we can make an estimate, from the model results, of the transition probabilities for the observed present-day AMOC.
....
Summary and Discussion

In this paper we investigated the probability of noise-induced transitions of the AMOC to a collapsed state within a specific time period, using a conceptual box-model representation of the AMOC circulation17. Thanks to its simplicity, the model is suitable for the application of the Trajectory-Adaptive Multilevel Splitting (TAMS) algorithm. At the same time, it is quite comprehensive in terms of physical processes driving the circulation and allows to calculate the freshwater transported by the AMOC at 30°S (Mov), which connects the results of our model to state-of-art climate models and observations. In the model, the sign of Mov represents a perfect indicator for the multiple equilibria regime (Fig. 2d), in line with what has been found in more detailed numerical models8,11,15.
The analysis of the time evolution of the stochastic model shows that two kinds of transitions occur, namely a cessation of the downwelling in the North Atlantic (called F-type transition) and a full transition to a collapsed state (called S-type transition). We found that, while an F-type transition can have very high transition probabilities over a period of 100 years under a reasonable choice of the parameters, the S-type transition seems unlikely to occur over this period, regardless of the values of the parameters involved. As expected, the probability of F-type transitions increases with decreasing Mov (more negative) and with increasing noise amplitude fσ (see Fig. 4a). For the area in the parameter space by which the present-day climate is best represented, our results indicate that the probability of a (temporary) cessation of the downwelling is almost certain for values of Mov < −0.2 Sv.
Indeed, such transitions may have been found already in the RAPID program measurements3,27: the dips in the time series of the AMOC strength at 26.5°N (up to negative values) suggest the occurrence of extreme events in the circulation which are not directly connected to any subsequent collapse of the whole circulation system. They may be induced either by noise in the freshwater flux, in the heat flux or in the wind-stress field. The same phenomenon can be found in most of the CMIP5 models, where the time series of the AMOC at 26.5°N shows several dips during control simulations. The comparison between the occurrence of extremes in the transports associated with wind anomalies and dips in the AMOC strength suggests that the role of the stochastic buoyancy forcing can lead to extreme events in the AMOC. Indeed, while some extreme events in the AMOC can be attributed to anomalies in the wind field, others seem to occur independently of those anomalies. Therefore, we believe that anomalies in the freshwater forcing are responsible for (F-type) transitions in the AMOC (see the Supplementary Section G for more details).
In the context of paleoclimate transitions, such as the Dansgaard-Oeschger events, it is interesting that S-type transitions, involving a full-scale transition to an ‘off’ state, have only non-negligible transition probabilities in our model on multi-millennial time scales. However, to connect our model results to these events, a change in the background climate state (glacial) is necessary and possibly also a slow variation of the noise and the freshwater forcing should be introduced in the model, which is outside the scope of this paper.
 

trichrider

Kiss My Ring
Veteran
Are the various world governments/UN involved in "climate change crisis hypocrisy"


Thought of the Day - Happy New Year and yet there are those blaring (pointy) questions, transferred from the previous decade to this decade. (i) Are the various world governments/UN involved in “climate change crisis hypocrisy,” (ii) and is there actually a worldwide crisis or not?

According to some, who have voiced their “opinions” on this purported climate change crisis, we have only, approximately, eight years left—not even a full decade.
“With today’s emissions levels, that remaining [carbon dioxide] budget will be entirely gone within less than eight and a half years,” Thunberg said.
These are some pretty hefty words coming from a child, let alone some heads of state, but, and there is always a but, if she is correct why is any government, that is participating in this purported climate crisis, involved in trade with any country that is not going to stop all use of carbon producing commodities?

Why is any government, and/or the United Nations, not putting sanctions and/or stopping all corporations from dealing with companies involved in the use of fossil fuels/carbon creation – including through the process of manufacturing?

Mark Carney, Former Bank of Canada Governor, present Bank of England Governor and future special envoy for climate action and finance to the United Nations (UN) has stated:
“He said companies have to be more transparent about their carbon footprints and make public their plans for how to help get to a net-zero emissions economy by 2050 — as required by U.K. law — so that the public knows how its money is being invested.”
Mr. Carney is negligent if all he wants is corporations to report their carbon footprints, isn’t he? If we are in such a global crisis why would someone, in his position, have the audacity to even suggest such meager measures if, as Greta has so viciously stated, we only have eight years left? Any government representative and surely the future special envoy to the UN should be doing more than merely suggesting corporations make public their carbon footprints, shouldn’t they? This merely sounds like job creation for, yet, another bureaucracy (hypocrisy), doesn’t it?

And why isn’t Mr. Carney, Prime Minister Justin Trudeau, President Emmanuel Macron, etc., calling, if there is such a crisis, for sanctions against those countries who continue to participate in the use of “carbon creation” during any process? One only has to look at the world map to see those countries involved in merely the use of coal. (Carbon Brief Global Coal Power – Clear on Climate)

And aren’t Mr. Carney, et al, words merely feeding some countries appetite for coal use? When one considers there is a new report which states:
“Global Slowdown in Coal Power Investment Continues, but Chinese Power Industry Pushes for Hundreds of New Plants”
Isn’t this merely making it even less expensive for countries who use coal to actually purchase it? Anyone involved in supply and demand can tell you if you have an abundance of/in supply, in any market, and less demand (other countries shutting down their use of coal), the price of the that commodity (coal) drops significantly, making that commodity very favourable for purchase, doesn’t it? And hasn’t it been that way since the beginning of trade on any scale?

Now the United Nations, based on its purported Charter, is supposed to be able to “take action on the issues confronting humanity in the 21st century, such as peace and security, climate change, sustainable development, human rights, disarmament, terrorism, humanitarian and health emergencies, gender equality, governance, food production, and more.” https://www.un.org/en/sections/about-un/overview/index.html

If this entity is so all powerful why isn’t it taking action? Wouldn’t one think that with it having 193 member states it could have the majority of these member states place sanctions on the countries who are placing the people of earth is such a precarious position? Even the UN Chief has stated:
“Antonio Guterres has taken the world’s major economies to task for not “pulling their weight” to reduce emissions. Ahead of the COP25 climate summit, the UN head said we were rapidly approaching the “point of no return.”
And why is the UN not placing sanctions against and/or stopping all commerce with the likes of China, India, etc., based on their use of “carbon creating fuels” to run their nations and manufacturing?
 

trichrider

Kiss My Ring
Veteran
Slowdown of the Walker circulation at solar cycle maximum

View ORCID ProfileStergios Misios, Lesley J. Gray, Mads F. Knudsen, Christoffer Karoff, Hauke Schmidt, and View ORCID ProfileJoanna D. Haigh
PNAS April 9, 2019 116 (15) 7186-7191; first published March 29, 2019 https://doi.org/10.1073/pnas.1815060116


  1. Edited by Isaac M. Held, Geophysical Fluid Dynamics Laboratory, National Oceanic and Atmospheric Administration, Princeton, NJ, and approved February 25, 2019 (received for review August 31, 2018)
Significance

Influences of the 11-y solar cycle (SC) on climate have been speculated, but here we provide robust evidence that the SC affects decadal variability in the tropical Pacific. By analyzing independent observations, we demonstrate a slowdown of the Pacific Walker Circulation (PWC) at SC maximum. We find a muted hydrological cycle at solar maximum that weakens the PWC and this is amplified by a Bjerknes feedback. Given that a similar muted hydrological cycle has been simulated under increased greenhouse gas forcing, our results strengthen confidence in model predictions of a weakened PWC in a warmer climate. The results also suggest that SC forcing is a source of skill for decadal predictions in the Indo-Pacific region.

Abstract

The Pacific Walker Circulation (PWC) fluctuates on interannual and multidecadal timescales under the influence of internal variability and external forcings. Here, we provide observational evidence that the 11-y solar cycle (SC) affects the PWC on decadal timescales. We observe a robust reduction of east–west sea-level pressure gradients over the Indo-Pacific Ocean during solar maxima and the following 1–2 y. This reduction is associated with westerly wind anomalies at the surface and throughout the equatorial troposphere in the western/central Pacific paired with an eastward shift of convective precipitation that brings more rainfall to the central Pacific. We show that this is initiated by a thermodynamical response of the global hydrological cycle to surface warming, further amplified by atmosphere–ocean coupling, leading to larger positive ocean temperature anomalies in the equatorial Pacific than expected from simple radiative forcing considerations. The observed solar modulation of the PWC is supported by a set of coupled ocean–atmosphere climate model simulations forced only by SC irradiance variations. We highlight the importance of a muted hydrology mechanism that acts to weaken the PWC. Demonstration of this mechanism acting on the 11-y SC timescale adds confidence in model predictions that the same mechanism also weakens the PWC under increasing greenhouse gas forcing.


The Pacific Walker Circulation (PWC) consists of a large-scale zonal overturning atmospheric circulation pattern over the equatorial Indian and Pacific Oceans that plays a key role in global climate by redistributing heat and precipitation. On interannual timescales, the PWC is tightly coupled to local variations of sea-surface temperatures (SSTs) associated with the El Niño Southern Oscillation (ENSO); its warm phase causes reduced sea-level pressure (SLP) gradients between the western and eastern Pacific, weaker trade winds, an eastward displacement of the PWC, and increased rainfall in the central/east Pacific (1). Model simulations of climate change indicate an overall weakening of the PWC, explained in terms of a muted hydrology cycle as global-mean precipitation increases (2–3%/K of surface warming) at a lower rate than atmospheric humidity (∼7%/K following the Clausius–Clapeyron, C-C, relationship) (2, 3). However, observational evidence of PWC trends in the 20th century is contradictory, depending on the diagnostics examined and which time period is selected, especially as the last few decades have been characterized by a number of La Niña events that result in a strengthened rather than a weakened PWC (46).
In view of the inconclusive observational evidence for the greenhouse gas (GHG) response, one approach is to look for improved insight by examining the transient response of tropical climate to other external factors. Examination of the response to the 11-y solar cycle (SC) forcing presents such an opportunity. There is a variety of observational evidence for an SC influence at the Earth’s surface, generally interpreted in terms of a “top-down” stratospheric influence via UV irradiance and ozone changes and “bottom-up” influences via total solar irradiance (TSI) and hence surface heating (7). The bottom-up mechanism is most likely the primary influence in the Indo-Pacific (79), but there have been contradictory interpretations of the observations. Composite analyses have associated SC maximum (Smax) years with negative SST anomalies in the equatorial Pacific, stronger east–west SLP gradient, enhanced surface easterlies, and ultimately a stronger PWC (1012). However, ENSO variability may severely contaminate signals in composites of limited time periods (13, 14). Alternative approaches such as multiple regression analysis that take into account variability associated with ENSO and other forcings (e.g., volcanic) suggest a warmer equatorial Pacific Ocean (∼0.4 K) lagging Smax by 1–2 y (13, 15), which slackens the east–west SLP gradient and reduces the strength of the PWC. Given that the radiative imbalance at the top of the atmosphere barely exceeds 0.18 W/m2 between Smin and Smax, radiative forcing alone suggests a very modest global-mean surface warming of only 0.08–0.16 K (15). The considerably stronger sensitivity detected in the Pacific is thought to be due to feedbacks between the direct surface heating, clouds/precipitation changes, and dynamical ocean adjustments (79).
A weakened PWC in response to Smax has been identified, albeit with varying strength, in the majority of climate models. Responding to warmer Pacific SSTs at Smax, the models simulate an increase in tropical precipitation (16), deep convection shifts from the maritime continent toward the central Pacific, and the easterly trade winds slacken, the latter indicating a weakening and eastward displacement of the upward branch of the PWC (17). Extensive examination of the historical simulations in the fifth phase of the Coupled Model Intercomparison Project (CMIP5) (18) attributed the weakened PWC response to the weaker sensitivity of global precipitation to surface warming (∼1.9%/K) compared with global atmospheric moistening (∼6.6%/K).
It turns out, therefore, that the muted hydrological cycle mechanism may slow down the PWC under both SC and GHG forcings, at least in climate models. Here, we demonstrate the transient response of the PWC to the SC in a variety of independent observational records spanning the second half of the 20th century. The periodic nature of SC forcing reduces the potential influence of uncorrected observational biases in existing datasets that often hamper the detection of longer-term trends. Our methodology is based on a simple lead/lag multiple-linear regression (MLR) that includes ENSO, volcanic, and GHG forcings, as well as the SC (Materials and Methods). We find a clear, statistically significant weakening of the PWC at Smax. Idealized model simulations support the observational pattern of a weakened PWC, and are interpreted in terms of the bottom-up mechanism, initiated by a zonally uniform SST warming and amplified by an ocean–atmosphere (Bjerknes) feedback.
...
Summary and Discussion

Studies of the response to centennial increases in TSI have suggested a contrasting response, with reduced rainfall in the Pacific and stronger east–west SST gradients (28). However, this response is not supported by a recent multimodel comparison of the tropical impacts of a step-change doubling of CO2 concentration versus a 2% increase in TSI (29). In those simulations, both forcings produced strikingly similar patterns of increased precipitation over the central Pacific and a relaxed east–west SST gradient, despite the fact that TSI predominately affects the surface, whereas GHGs perturb the radiative balance of the troposphere. In fact, the globally averaged precipitation is expected to increase at higher rates for the same surface warming under TSI than GHG forcing (24). Likewise, we find no evidence for divergent patterns in the Pacific response given that the detected patterns of increased rainfall, relaxed SST gradient, positive ΔSLP anomalies, and a weakened PWC in response to SC resemble modeled responses to 2% TSI and doubling CO2, despite subtle differences in the timescale and the magnitude of the forcing (2% TSI roughly corresponds to 20× the SC amplitude).
By highlighting the importance of global hydrology in mediating SC responses in the tropical Pacific, our findings add confidence in the modeled predictions for a weakened PWC, driven by similar hydrological changes in response to GHG forcing. We are not suggesting, however, that observed SC signatures can be used as an analog for quantifying future PWC responses to GHGs. This is because we identify ΔSLP changes of about 300 Pa/K (24–28 Pa per 1 W/m2 TSI associated with about 0.08 K per 1 W/m2) between solar maximum and minimum, which are considerably larger than the observed century-long ΔSLP trends (50–100 Pa/K scaled to the global-mean SST warming) (4, 5). Reasons for reduced sensitivity in the case of GHG forcing are likely to be found in the pattern of SST response in the Pacific, which is ill constrained in observations and/or cancellation from opposing mechanisms that may not be as effective on the 11-y SC timescale. For example, a long-term adjustment of the thermocline to GHG forcing has been found to reduce the effectiveness of the Bjerknes feedback (30), while our analysis, instead, highlights the importance of this feedback in reinforcing wind and SST anomalies and ultimately the PWC reduction. In summary, we propose a bottom-up pathway by which the SC influence in global hydrology induces weak westerly surface wind anomalies which are then amplified by the Bjerknes ocean–atmosphere feedback (and possibly also a wind–evaporation–SST feedback), leading to the further reduction and eastward shift of the PWC, positive SSTs, and more rainfall in the equatorial Pacific. This study suggests that SC forcing is an appreciable source of decadal variability in the Indo-Pacific and further studies are required to assess the potential to improve decadal predictability in this region.


paper here (for those who can read): https://www.pnas.org/content/116/15/7186
 
M

moose eater

While the first half of this winter seemed -much- warmer than average, the last 3 to 4 weeks here at our home in the Interior have been locked into what is NEARLY an old-fashioned Interior Alaska winter. My front porch has, for the most part, been -20 f to -45 f. for the last (majority of a) month.

I'm currently -46 f on the front porch. And my normal thermal inversion that would have me 5 to 20 degrees warmer than the airport temps in town (NOAA's local official site) has been stolen by the Grinch. We've been 4 to 12 degrees COLDER than NOAA's airport temps for a month now. I've seen this strange switcheroo in the past, but never for a solid month+, and yes, I'm using a mercury-in-glass decent quality outdoor thermometer that goes down to -60+, not a large clock-shaped Chinese plastic dial that lies most of the year.

Mind you, I haven't seen -50 for any duration in years, let alone -65, as we were known years ago to see on occasion. (The unofficial record at my old cabin on the River, for my life-time, had been -74 f , the winter of 1989).

So, overall, the Interior is indeed warming A BIT in winter, cooler in summer, and more wet (breather tube on the snow blower iced up and blew out the pressure relief seal for the 1st time EVER, due to increased humidity).

The coastal warmth this last year, accompanied by coastal drought (with coastal drought previously unheard of in my past experience) has contributed to an OVERALL (official) statement that this past year may go down as Alaska's warmest, but that assessment was HEAVILY influenced by the coastal anomalies. (*The small community of Seldovia, a boat-in, or fly-in community, around the 'horn' from Homer) was running out of water at one point this last summer/fall.... BIZARRE!!

With my ailing circulation in my hands and feet, I certainly don't miss the "good ol' days" where we might get 3-6 weeks of -35 f to -65 f., seemingly unrelenting. But I can assure you that any duration of -35 f. to -46 f. is plenty cold as I age.

They keep forecasting a rise in temperatures to somewhere near -5 f. at some point, then pushing it back (several times now; the elusive 'warming'). I think (cynically and humorously) that it's just NOAA providing some sort of placebo forecast for the Cheechakos (with no personal references to the truly cold days of old), so they don't just give up hope and start 'offing' themselves over the on-going run of -20 to -46 weather.

But that's where tequila and weed come in, if not some well-stashed hallucinogens. Distantly like the ground hog and his shadow, we may arise, pleasantly rested, from what ever drug-induced fog, come March or so, right around time to head into the bush for our annual remote (mountains) lake trout and burbot ice fishing ritual.
 

trichrider

Kiss My Ring
Veteran
What failed predictions are you talking about? Some exerts from a recent article. From the 7 News site:

In 2008, a climate change report made an eerie prediction that Australia would face an extreme bushfire season in 2020.

At least 22 people have died and more than 1700 homes have been destroyed as catastrophic bushfires continue to wreak havoc across the country in what has been described as an unprecedented event.

Now, 12 years on, the Garnaut Climate Change Review is back in the spotlight as angered Aussies share its findings that warned of what was to come.

Written by distinguished economist Ross Garnaut, the report used projections to predict bushfire seasons would progressively "start earlier, end slightly later and generally be more intense".

The report went on to make projected increases in the number of days with extreme fire weather.

It claimed that, in 2013, there could be +5-25 extreme fire days and as many as +100-300 in 2067, a 300 per cent increase.

The study was initiated in 2007 by then-leader of the opposition, Kevin Rudd, and the leaders of all states and territories.

The aim of the independent study was "to examine the impacts of climate change on the Australian economy".

Garnaut was tasked "to recommend medium to long term policies and policy frameworks to improve the prospects of sustainable prosperity".

In 2008, the federal government, then under the prime ministership of Rudd, accepted several of the report's key recommendations.

But the government failed to pass arguably one of the most important - an emissions trading scheme.
https://7news.com.au/news/bushfires...e-increase-of-fire-intensity-by-2020-c-636017

Oh, and in case you missed the temperature graph I posted earlier;
View Image


Hijacking Australian 2019 Bushfire Tragedies to Fearmonger Climate Change

Guest Blogger / 23 hours ago January 4, 2020
Guest post by Jim Steele, director emeritus of the Sierra Nevada Field Campus, SFSU and author of Landscapes and Cycles: An Environmentalist’s Journey to Climate Skepticism.


As is customary now, whenever tragedy strikes, the internet buzzes with articles blaming climate change. Hijacking the tragic Australia’s bushfires was to be expected. For instance, Microsoft’s MSN website just published “Climate deniers are cooking themselves — and everyone else”. They wrote, “Fires get worse when things are hot, dry, and windy, and climate change has provided all of those conditions in abundance. The continent has warmed by about 2 degrees Fahrenheit (a bit over 1 degree Celsius) since the 1970s, and in keeping with the predictions of climate models, Australia has experienced steadily worse droughts and heat waves over the last 30 years. The current drought may end up being the worst in history — this spring was the driest ever recorded on the continent, and back on December 18 it set a new record for the hottest day ever measured with an average temperature across the entire country of 105.6 degrees.”
How truthful is MSN? Indeed, Australia is experiencing hot dry summer weather. The map below (Figure 1) shows that most of Australia experienced temperatures far above average for December 18, 2019. But curiously the east and west coasts, as well as northern Australia were experiencing temperatures several degrees below normal. If global warming was driving the extreme wildfire season, we would expect the worse fires to be located where temperatures were warmest. But as the map of wildfires reveals (Figure 2), the warmest regions had the least wildfires, while the most fires were happening in the cooler regions. Averaging Australia’s temperatures to deceptively blame global warming for the wildfires only obscures the regional temperature effects.
ic
Figure 1 Australia December 18, 2019 temperature anomalies.

ic
Figure 2 Locations of Australia’s 2019/2020 bushfires. https://www.newsweek.com/australia-wildfire-map-update-bushfires-sydney-new-south-wales-1480207

MSN’s climate fearmongers dishonestly claim “Australia has experienced steadily worse droughts.” Climate fearmongers argue warmer temperatures will evaporate surface moisture more quickly and exacerbate droughts. But they have the tail wagging the dog. Australia’s Bureau of Meteorology’s illustration (Figure 3) shows the 1920s and 30s had experienced much worse droughts than recent decades. Furthermore, during periods of low precipitation, drought conditions CAUSE higher temperatures. Without normal soil moisture to evaporate, solar radiation is no longer consumed as latent heat of evaporation, but instead, rapidly raises land temperatures.
ic
Figure 3 Australia average annual precipitation from 1900-2018. https://www.bom.gov.au/climate/history/rainfall/

The greatest 2019/2020 burned area is concentrated along the eastern coast in the states of New South Wales and Victoria. Both areas are known for habitat that is very susceptible to extreme fire danger. But are the recent fires than worse ever? History says NO! In February 1851, the Black Thursday bushfires incinerated about five million hectares (about 1,900 square miles). Around 12 lives, one million sheep and thousands of cattle were lost. Temperatures reached record extremes of about 47°C (117°F) in the shade. In contrast, MSN attributes the 2019 December fires to a misleading average temperature across the whole country of 40.6°C (105°F).
If temperature and precipitation cannot be attributed to the increasing trend in wildfires, what other factors should be considered? As in California, Australia has experience a tremendous increase in human ignitions. Arson is a huge problem. As government investigations reveal (Figure 4), deliberately set fires account for 66% of all ignitions, while only 11% of all wildfires are due to natural lightning ignitions.
ic
Figure 4 Cause of wildfire ignitions. https://aic.gov.au/publications/bfab/bfab021

Furthermore to the north, tropical and subtropical regions are being invaded by foreign grasses that are easily ignited and provide greater surface fuel continuity allowing fires to spread over greater areas. Likewise, humans must manage forest floor fuel loads. The easiest solution is prescribed burns. However, that solution is often resisted because people do not want to experience the accompanying smoke. But until prescribed burns are allowed to be judiciously applied, the public becomes increasingly vulnerable to larger more severe wildfires as endured in 2019.
Bad analyses always promote bad remedies! Blaming rising CO2 concentrations and global warming is only misdirecting real efforts to minimize wildfire destruction. What Australia and the world needs to address is 1) human ignitions, 2) invasive grasses and 3) fire suppression that allows surface fuels to accumulate and enable large intense and destructive fires to wreak havoc like never before!
 

trichrider

Kiss My Ring
Veteran
The top 10 biggest bombshell climate TRUTH stories of 2019

Thursday, December 19, 2019 by: Ethan Huff

ChemtrailsFrontSmoke.jpg

(Natural News) Now that we have climate children on the autism spectrum sailing around the world lecturing adults about an impending global warming “emergency,” it’s more important than perhaps ever before to set the record straight. Here are 10 stories from this past year that expose the prevailing climate narrative as a total hoax:
NASA admits that climate change occurs because of changes in Earth’s solar orbit, and NOT because of SUVs and fossil fuels

It’s not your SUV or love for meat that’s causing our climate to fluctuate, but rather the sun itself. This was discovered by NASA as far back as 1958, but you won’t hear little Greta Thunberg talking about it at any of her climate fascism rallies.
Because NASA has since been co-opted by the climate lobby, the space agency has chosen to ignore its own findings from way back when and continue to allow climate lies to prevail, to the detriment of our freedoms and liberties.

Climate change hoax COLLAPSES as new science finds human activity has virtually zero impact on global temperatures

As it turns out, humans have almost no impact on the climate at all, even when they’re heavy polluters. Human activity has contributed less than 0.01 degrees’ worth of warming to our planet since measurements first began, while ordinary phenomena like low cloud cover have a much more significant impact on climate conditions.


NASA declares carbon dioxide is GREENING the Earth… reveals how Green New Death is a DEATH cult that would collapse global ecology

Leftists love to talk about addressing so-called climate change through policy changes, but the one they trotted out this past year, known as the “Green New Deal,” wouldn’t do anything to fix the planet. In fact, it would destroy it, seeing as how carbon dioxide (CO2) is necessary for plants to stay alive and green.

How the Associated Press LIES about climate science to push the global warming agenda

Many mainstream media outlets reject this fact, however, including the Associated Press (AP), which published numerous fake climate articles this past year insinuating that extreme warming and extreme cooling are occurring when they’re actually not, at least according to historical data.


Climate alarmists drop the polar bear as their mascot since polar bears are thriving, with record population numbers

Another climate myth that was shattered in 2019 was the dying polar bear image. For decades, we’ve all been told that polar bears are dying off in large numbers due to polar ice cap melting. But as it turns out, polar bear populations are exploding in many areas, so much so that they’re now becoming a nuisance.


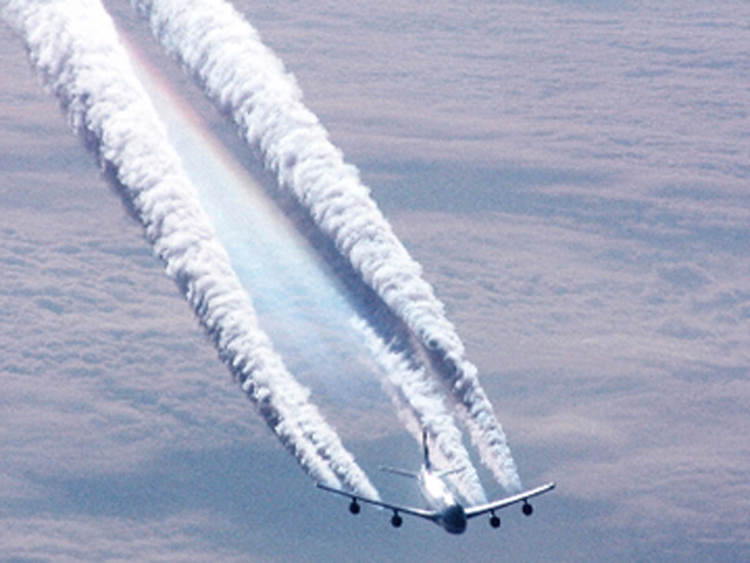
BOMBSHELL: Global geoengineering (chemtrails) experiment pushed by Bill Gates also funded by Nazi-linked Alfred P. Sloan Foundation, linked to eugenics and depopulation

We also learned this year that chemtrails, also known as geoengineering, are, in fact, real – and that chemtrail programs are being funded by Bill Gates and the Alfred P. Sloan Foundation, a eugenics and depopulation organization linked to Nazi Germany.

Harvard study finds that wind turbines create MORE global warming than the fossil fuels they eliminate – and the same is true for scooters and electric cars

The solution to global warming, we’ve long been told, is “renewable” energy, including wind turbines that are supposedly carbon-neutral. But there’s just one problem: Wind turbines actually create more global warming than fossil fuels whomp, whomp.


All the biggest lies about climate change DEBUNKED in one astonishing interview

Here are some more truth bombs from 2019: CO2 is good for the planet, because without it all plant life would die, which means no more oxygen for humans to breathe. The so-called “greenhouse effect” is also not a bad thing, as it keeps things green, just like its name suggests.
But because the climate propaganda is being laid on thick, especially at our institutions of “higher learning,” the next generation isn’t being told about the importance of CO2 and its corresponding greenhouse effect for the continued sustenance of life on earth.

Bombshell science study shows that electric cars are DIRTIER for the planet than diesel vehicles

What about combustion engines versus electric cars? The latter is actually a bigger polluter than the former, as the amount of CO2 emissions generated by electric vehicle battery production is anywhere from 11 to 28 percent higher than what’s required to produce a standard diesel engine.


Environmentalists are at WAR with life on Earth… total collapse of ecosystem the real goal of ‘climate’ propagandists

Meddling with the climate in the way that leftists are now trying to do with geoengineering, genetically modified organisms (GMOs) and other unnatural interventions is beginning to cause all sorts of problems – problems that the climate lobby is completely ignoring.
While photosynthesis requires sunlight, CO2, and water in order to happen, climate propagandists have waged war on the first two inputs, which means the climate change movement is actually a death cult.
 

trichrider

Kiss My Ring
Veteran
Heinrich and Dansgaard–Oeschger Events

Climate during the last glacial period was far from stable. Heinrich and Dansgaard-Oeschger events, occurred repeatedly throughout most of this time. Scientists Willi Dansgaard and Hans Oeschger first reported the Dansgaard-Oeschger (D-O) events in Greenland ice cores. Each of the 25 observed D-O events consisted of an abrupt warming to near-interglacial conditions that occurred in a matter of decades and was followed by a gradual cooling.

Related to some of the coldest intervals between D-O events were six distinctive events, named after paleoclimatologist Hartmut Heinrich, that are recorded in North Atlantic marine sediments as layers with a large amount of coarse-grained sediments derived from land. These layers, which are continuous across large areas of the North Atlantic, are evidence for both an increase in icebergs discharged from the Laurentide ice sheet in North America and a southward extension of cold, polar waters (Bond et al. 1992). Icebergs carry sand-sized grains eroded by ice sheets. When icebergs encounter warmer ocean water, they melt and drop their sediment load onto the seafloor. A southward extension of cold, polar waters allowed icebergs to travel farther before melting. Heinrich events occurred less frequently than D-O events. D-O events repeated every several thousand years on average, while ~10,000 years elapsed between Heinrich events. Neither of the two types of events is strictly periodic, however.


What caused Heinrich and Dansgaard–Oeschger events?

The cause of these glacial events is still under debate. During the last glacial time, large ice sheets rimmed the North Atlantic. At certain times, these ice sheets released large amounts of freshwater into the North Atlantic. Heinrich events are an extreme example of this, when the Laurentide ice sheet disgorged excessively large amounts of freshwater into the Labrador Sea in the form of icebergs. Scientists have hypothesized that these freshwater dumps reduced ocean salinity enough to slow deepwater formation and the thermohaline circulation. Since the thermohaline circulation plays an important role in transporting heat northward, a slowdown would cause the North Atlantic to cool. Later, as the addition of freshwater decreased, ocean salinity and deepwater formation increased and climate conditions recovered.
Evidence for changes in deepwater formation supports the freshwater forcing hypothesis. Measurements from deep-sea sediments in the North Atlantic indicate reduction of deepwater formation during Heinrich events (McManus et al. 2004). Evidence for freshwater forcing and reduced deepwater formation during D-O events is more ambiguous. The initial trigger for freshwater releases has not yet been identified. One suggestion is that small, gradual changes in solar output could have influenced the timing of abrupt changes. Other ideas call upon natural oscillations of the ice sheets themselves or of ocean processes.


How widespread were climate changes?

Heinrich and D-O events had a global footprint. During cold phases in the North Atlantic, large regions of North America and Eurasia became colder and drier (Benson et al. 1996; Allen et al. 1999; Genty et al. 2003; Wagner et al. 2010; Asmerom et al. 2010). A southward shift of the tropical rain belt caused drier conditions in the Northern Hemisphere while moistening many parts of the Southern Hemisphere (Wang et al. 2001; Cruz et al. 2005; Leduc et al. 2007; Kanner et al. 2012; Deplazes et al. 2013). Antarctic ice cores show warming, consistent with a reduction of northward heat transport from the Southern Hemisphere (Brook et al. 2005; EPICA Community Members 2006). The climate anomalies are consistent with a slowdown of the thermohaline circulation and reduced ocean heat transport into the northern high latitudes.


Some important datasets related to Heinrich and Dansgaard–Oeschger events:


Cannavore

Well-known member
Veteran
Yeah - what happened to winter? - over here in London U.K. its mid-winter, and we are not getting the freezing temperatures and snow/ice we used to get when I was a lad hardly at all - down here in the south of England right now (and for the past few years) - the weather is more like an extended autumn - or an early spring at this time of year - its confusing the heck out of the trees, plants and shrubs etc -

Before too long we might end up with the weather of southern Spain they say - then no-one will bother to go to Spain any more - so yes, I have noticed that this area has warmed up some - compared to what I remember it as -

i live down the street from a pond. half or maybe more of the duck population don't fly south for the winter any more because of the confusing weather.
 

geneva_sativa

Well-known member
There has been an ice age on the planet, in a recurring cycle, about every 100,00 years,,, there are seasons.

Winter is coming lol ,,, but autumn will arrive first :ying:

Shao Yung knew well,,, pole shifts, orbital angles, all relate with time , seasons
 

armedoldhippy

Well-known member
Veteran
It may be a safe bet to expect an early spring.

In Southern Oregon it's not quite as cold as usual. Haven't had to run a heater in the well house, which is something I do when it's in the teens in degrees F.

Rain is running a little less than half of usual amount. Enough to replenish the well.
built ONE fire in fireplace this winter. too warm to bother with. still have damn near all of my split hickory. WAY the hell more rain than normal & more on the way. i'd send you some back your way if possible...:)
 

armedoldhippy

Well-known member
Veteran
i live down the street from a pond. half or maybe more of the duck population don't fly south for the winter any more because of the confusing weather.

not seeing migrating birds here either. duck season is a near total loss. normally no robins here this time of year, plenty pulling worms up out of yard that is usually frozen solid. only thing missing from normal spring is the hummingbirds. i AM seeing some butterflies. too wet to get dads' old truck up to road to sell it, don't want to tear up yard & kill the grass.
 
H

hard rain

The top 10 biggest bombshell climate TRUTH stories of 2019

Thursday, December 19, 2019 by: Ethan Huff

View Image
(Natural News) Now that we have climate children on the autism spectrum sailing around the world lecturing adults about an impending global warming “emergency,” it’s more important than perhaps ever before to set the record straight. Here are 10 stories from this past year that expose the prevailing climate narrative as a total hoax:
NASA admits that climate change occurs because of changes in Earth’s solar orbit, and NOT because of SUVs and fossil fuels
.
Your first link is to "Natural News (formerly NewsTarget, which is now a separate sister site) is a conspiracy theory and fake news website."

Seriously that is fucked up. You have absolutely zero credibility. Stopped reading after that. NASA admits nothing of the sort. In fact their site is full of information about mans effect on the worlds climate.
https://en.wikipedia.org/wiki/Natural_News
 
H

hard rain

From NASA:
Do scientists agree on climate change?
Yes, the vast majority of actively publishing climate scientists – 97 percent – agree that humans are causing global warming and climate change. Most of the leading science organizations around the world have issued public statements expressing this, including international and U.S. science academies, the United Nations Intergovernmental Panel on Climate Change and a whole host of reputable scientific bodies around the world. A list of these organizations is provided here.

https://climate.nasa.gov/faq/17/do-scientists-agree-on-climate-change/
 

trichrider

Kiss My Ring
Veteran
Your first link is to "Natural News (formerly NewsTarget, which is now a separate sister site) is a conspiracy theory and fake news website."

Seriously that is fucked up. You have absolutely zero credibility. Stopped reading after that. NASA admits nothing of the sort. In fact their site is full of information about mans effect on the worlds climate.
https://en.wikipedia.org/wiki/Natural_News


:laughing:

keep swinging...
and you link to wackopedia :noway:
did snopes check that? lol


https://www.youtube.com/watch?v=xMc1o2tUBds

[youtubeif]xMc1o2tUBds[/youtubeif]
 
H

hard rain

:laughing:

keep swinging...
and you link to wackopedia :noway:
did snopes check that? lol


https://www.youtube.com/watch?v=xMc1o2tUBds

[youtubeif]xMc1o2tUBds[/youtubeif]
No problems, there is loads of information about this being a fake news site.
From Forbes
If you don’t know who Mike “Health Ranger” Adams is, he may be a steadfast presence in your social media newsfeed without your knowledge. Awarded the top slot on Real Clear Science’s “Worst Websites for Science in 2016” list, and with its founder touted by Dr. Oz as “the Renegade Health Ranger,” Natural News is a thorn in the sides of all who hold legitimate science dear. But bad science isn't Adams' only offense. Natural News is a fake news fixture, with articles on Obama birtherism, HIV/AIDS denialism, and the Sandy Hook tragedy as an elaborate hoax by FEMA to promote gun control. With the current uproar about fake news, the website and its founder should top lists of spurious sources.
https://www.forbes.com/sites/kavins...e-friends-dont-let-friends-read-natural-news/

Facebook has suspended Natural News from posting on the social media platform where it has amassed almost 3 million followers. Natural News, which pushes wild conspiracy theories and once published an injectable DIY homeopathic “vaccine” for Ebola, had already been banned from Twitter and YouTube. The site was also blacklisted by Google in 2017.
https://gizmodo.com/natural-news-suspended-on-facebook-founder-calls-for-p-1835367529

https://www.thedailybeast.com/how-natural-news-became-a-conspiracy-hub-rivaling-infowars
 

Latest posts

Latest posts

Top