What's new

Mapping cannabis prices nationwide

K

KSP

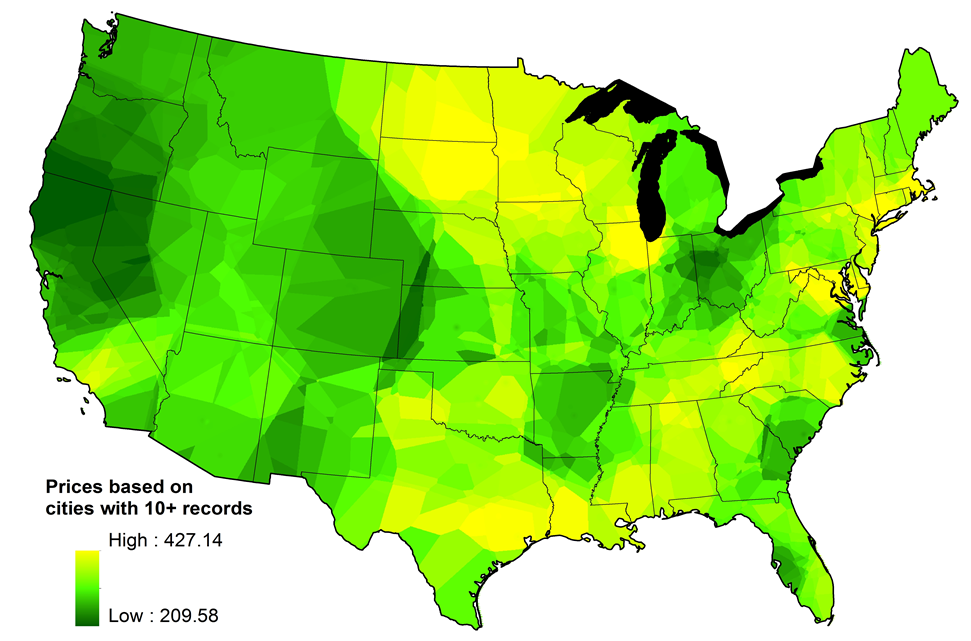
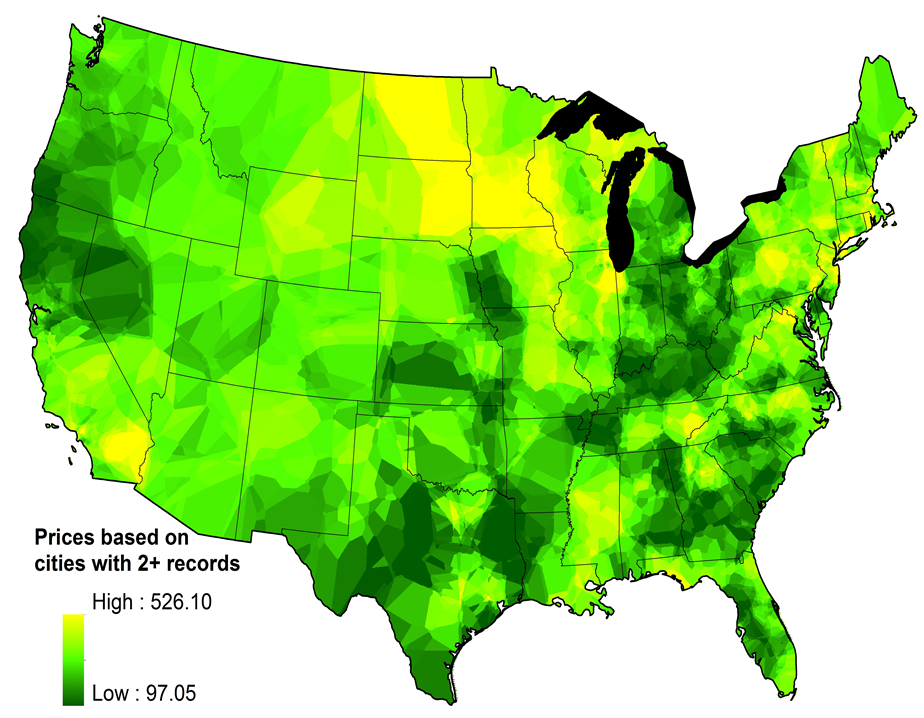
Just an article I came across today while searching for something else. I'm not sure how accurate it is given the source of data, but I'm not sure there is a better source of data.

Hope this is kosher to post as I know this can be a touchy subject here. If it's not kosher, apologies in advance.

http://www.floatingsheep.org/2011/08/price-of-weed.html


POW_2.PNG
 

MIway

Registered User
Veteran
I was in Minnesota for a short while... saw a very large bird of prey swing down into a field of MJ... snatched up two full size plants with it's claws & flew away. Later I was told that it was just a local mosquito, hence the shortage in weed & the high prices. Fucking things are big up there. ;-)
 
K

KSP

so what are the reasons for the higher prices?

Some of it is supply\demand, but I suspect some of those areas are artifacts of the methods used to make the map. For instance, look at the Tennessee - North Carolina border. I don't know, but it seems to me prices should be lower there. There aren't any large towns around there, and cities\towns were used to extrapolate prices. then again, maybe prices ARE that high in Knoxville, and that affects the map in that area.
 
K

KSP

I should have included the second map; the one in the OP was based on fewer data points.

"The map relies upon thousands of user reports on marijuana purchases referenced to city locations from the Priceofweed website (see our earlier posting). After cleaning the data to get rid of the outliers, we created a continuous surface using a statistical interpolation technique known as kriging to identify the average variance among price differences through a spherical semivariogram model. To obtain a price for each location show in the map above, an interpolated value was estimated as a weighted average of prices from its twelve neighboring points.

One of the issues in generating these maps is how many observations we would require at each point (or city) before including it in interpolation. Increasing the number of observations (e.g., n > 10) helps control error in the average price at each point but limits the number of points. Lowering the sample size requirement (e.g., > 2) results in more points upon which to base the interpolation but increases price variance. In order to visualize these differences compare the map above (n > 2) with the map below (n > 10). While the first map shows a finer resolution of price variation (albeit with a decrease in the accuracy of the pricing data) it is consistent with the patterns resulting from the rougher resolution in the second map.
"

POW_10.PNG
 

Sour Deez

Member
That second map seems more correct to me. I saw the first map and was like damn i know the wrong people. But the second seems good.
 

sneaky101

Member
I am a regular in the Knoxville area. Not a huge city, but a huge college town. The second map seems pretty close. Lots and lots of potheads! Rich college kids. The last few years I had to purchase all I did was good herb and breaks on prices were kind of hard to acquire unless you bought a ton.
 

Latest posts

Latest posts

Top