
St. Phatty
Active member
My belly sticks out too far.....
it protects your feet from getting sun-burned.
My belly sticks out too far.....
have you tried watercress sandwiches?My belly sticks out too far.....


not familiar with the reliability of this referenceView Image
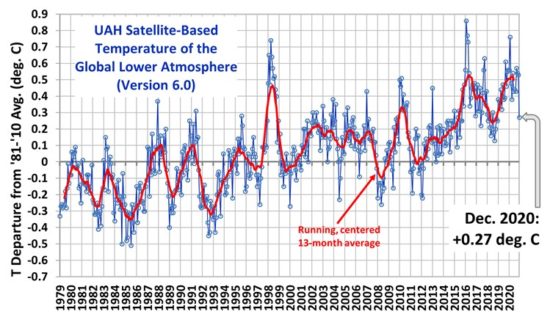
UAH Global Temperature Update for December 2020: +0.27 deg. C
January 2nd, 2021 by Roy W. Spencer, Ph. D. The Version 6.0 global average lower tropospheric temperature (LT) anomaly for December, 2020 was +0.27 deg. C, down substantially from the November, 2020 value of +0.53 deg. C.
https://www.drroyspencer.com/2021/01/uah-global-temperature-update-for-december-2020-0-27-deg-c/
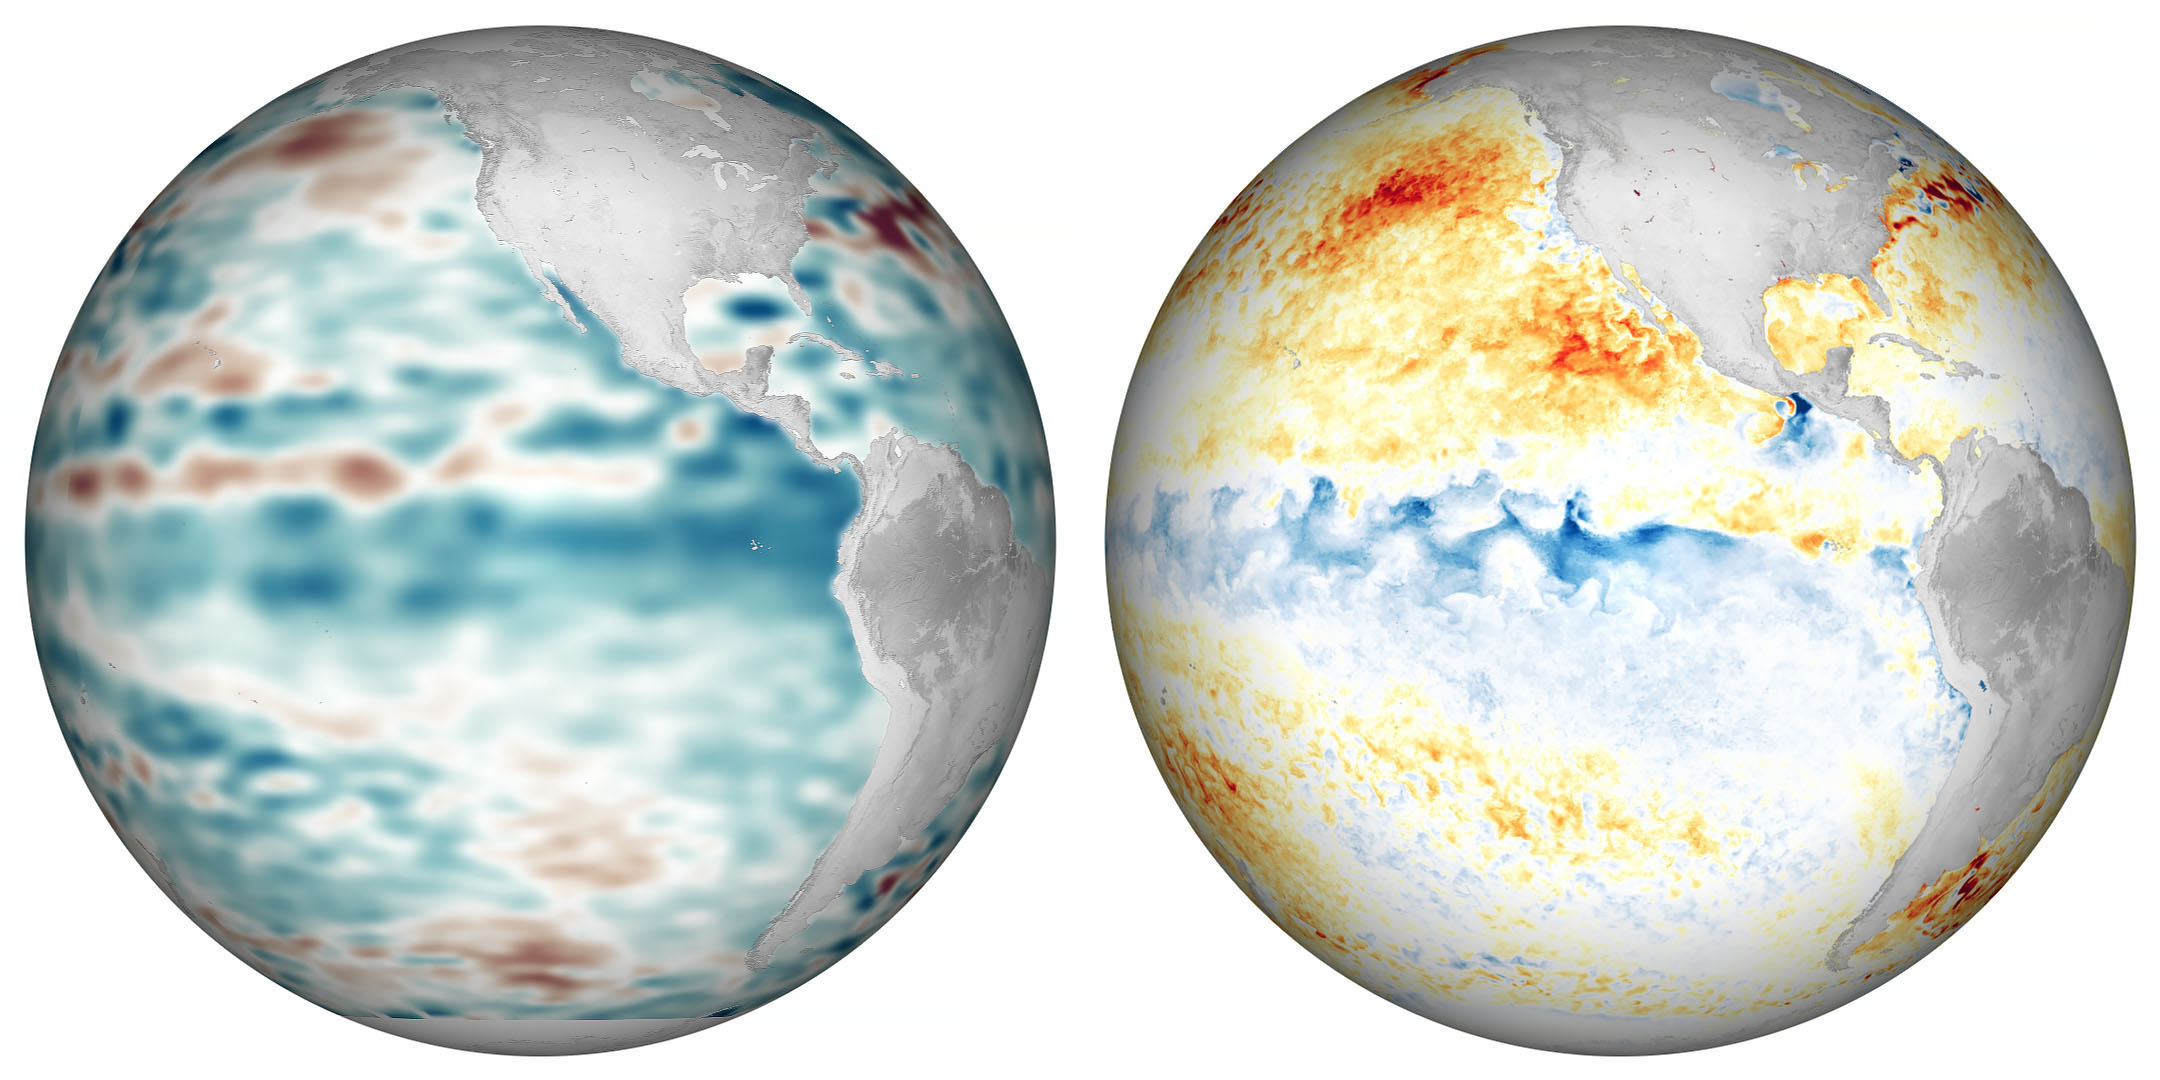
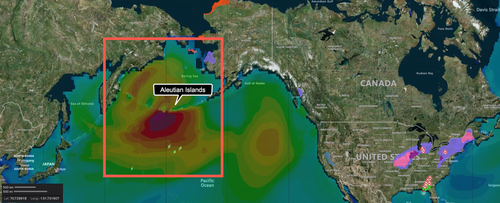
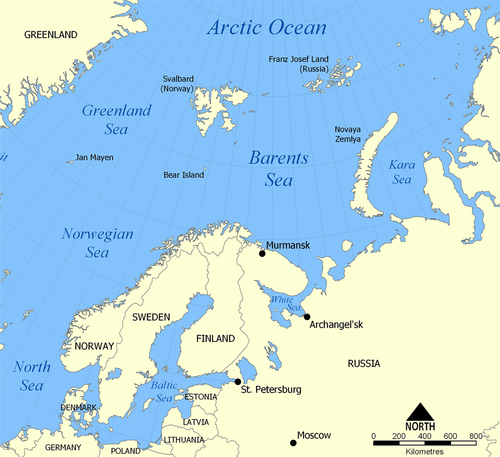
 Applications Aeolus shines a light on polar vortex
 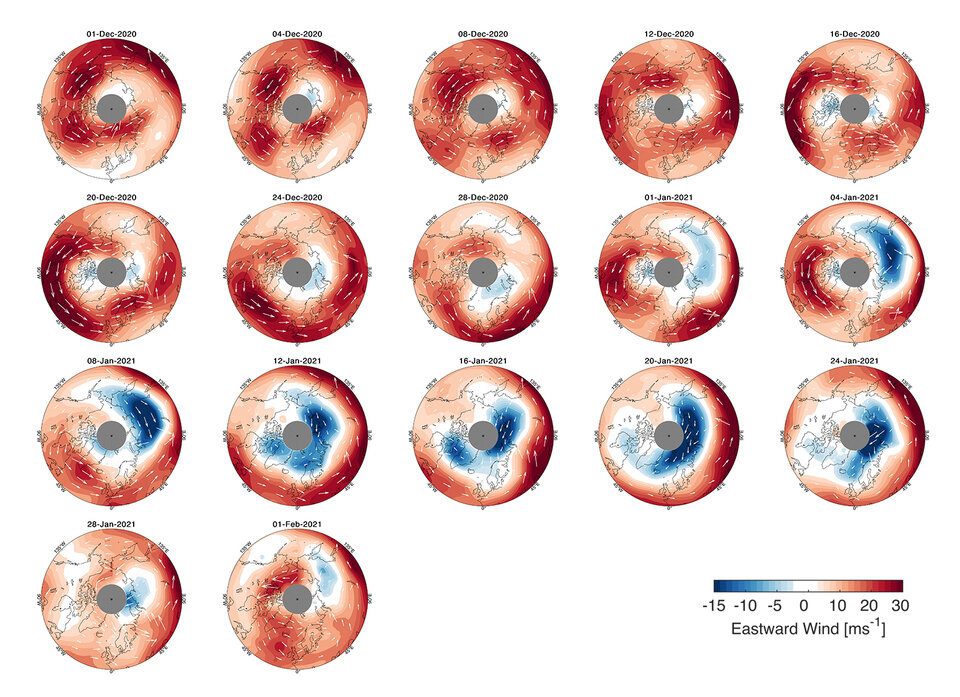 Polar vortex 1 December 2020 to 1 February 2021 One meteorological event that can disturb the polar vortex is known as a ‘sudden stratospheric warming’, which is what has been happening over the last month. Sudden stratospheric warmings happen to some extent every other year or so, but the current event has been categorised as major, and is less common.


Adelaide, South Australia, coolest and wettest week in 49 years, so much for global warming.
probably depends where in Texashttps://www.star-telegram.com/news/local/fort-worth/article249193010.html
Big highway pile-up with lots of deaths, related to unexpected ice on Texas freeway.
Is ice in Texas REALLY that unusual ? It sure caught hundreds of people by surprise on Thursday Feb. 11.
Adelaide, South Australia, coolest and wettest week in 49 years, so much for global warming.

https://www.star-telegram.com/news/local/fort-worth/article249193010.html
Big highway pile-up with lots of deaths, related to unexpected ice on Texas freeway.
Is ice in Texas REALLY that unusual ? It sure caught hundreds of people by surprise on Thursday Feb. 11.
[URL=https://www.esa.int/var/esa/storage/images/esa_multimedia/images/2021/02/polar_vortex_change/23130111-3-eng-GB/Polar_vortex_change_pillars.gif]View Image [/URL] Applications Aeolus shines a light on polar vortex
04/02/2021 2719 views 79 likes
ESA / Applications / Observing the Earth / Aeolus
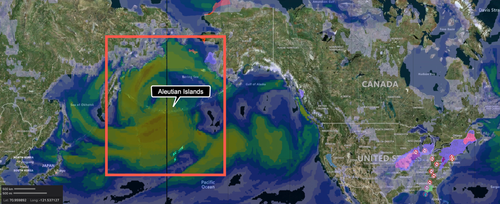
As this winter’s polar vortex currently sends extreme icy blasts of Arctic weather to some parts of the northern hemisphere such as the northeast of the US, scientists are using wind information from ESA’s Aeolus satellite to shed more light on this complex phenomenon.
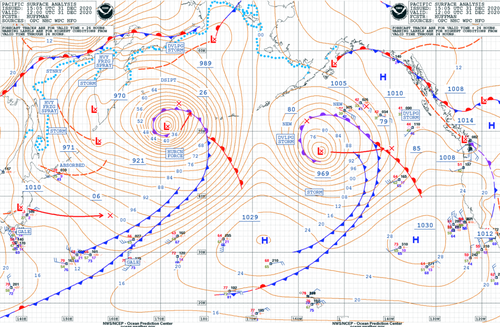
The polar vortex is a huge mass of frigid air high above the North Pole in the polar stratosphere. It is surrounded by a strong jet of air swirling counter-clockwise along the vortex’s boundary. The vortex tends to be much stronger in the winter, keeping bitter cold air locked in around the Arctic.
However, sometimes the vortex can weaken, become distorted or even split into two and meander further south, affecting the weather and jetstream further down in the troposphere, potentially bringing unusually cold weather and snow to lower latitudes.
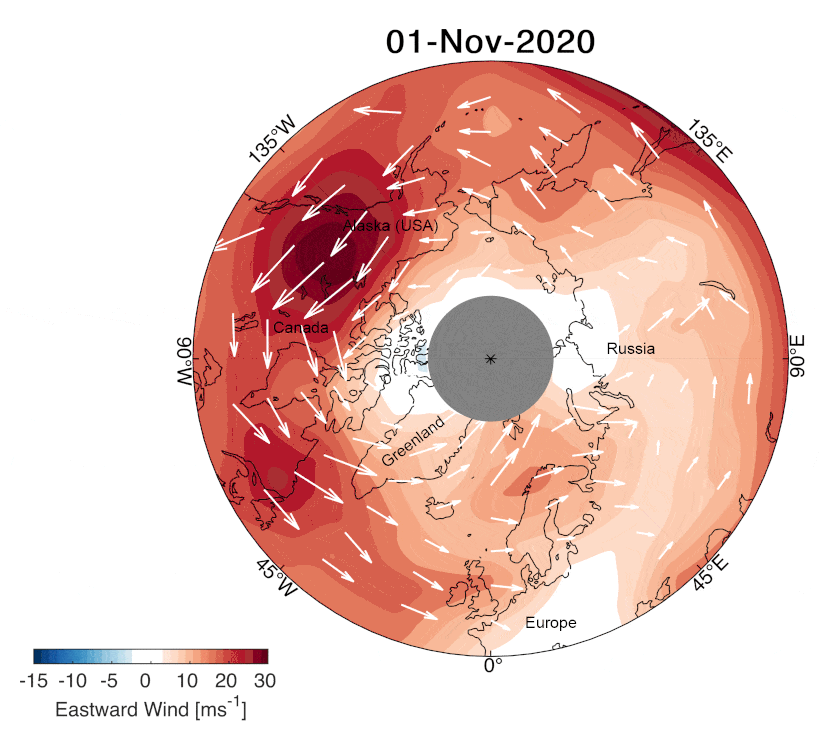
[URL=https://www.esa.int/var/esa/storage/images/esa_multimedia/images/2021/01/polar_vortex_1_december_2020_to_1_february_2021/23130067-1-eng-GB/Polar_vortex_1_December_2020_to_1_February_2021_article.jpg]View Image [/URL] Polar vortex 1 December 2020 to 1 February 2021 One meteorological event that can disturb the polar vortex is known as a ‘sudden stratospheric warming’, which is what has been happening over the last month. Sudden stratospheric warmings happen to some extent every other year or so, but the current event has been categorised as major, and is less common.
Such dramatic events cause the strong wind around the edge of the polar vortex to weaken or reverse, leading the temperature of the polar stratosphere to rise rapidly by up to 50°C degrees Celsius over several days.
Since these events can trigger extreme weather in Europe and North America, they are of scientific and practical interest. However, the processes involved are not fully understood, and until recently there have been major technical challenges in measuring wind from space, which is needed to measure and monitor such a large-scale event.
[URL=https://www.esa.int/var/esa/storage/images/esa_multimedia/images/2021/02/polar_vortex_change/23130111-3-eng-GB/Polar_vortex_change_article.gif]View Image [/URL]
Polar vortex change Fortunately, scientists now have ESA’s Aeolus satellite at hand to help understand more about why and how the polar vortex is pushed off balance.
Aeolus is the first satellite in orbit to profile directly Earth’s winds from space.
It works by emitting short, powerful pulses of ultraviolet light from a laser and measures the Doppler shift from the very small amount of light that is scattered back to the instrument from molecules and particles to deliver profiles of the horizontal speed of the world’s winds mostly in the east-west direction in the lowermost 26 km of the atmosphere.
Although Aeolus only measures wind in the lower part of the atmosphere, the lower part of the current stratospheric polar vortex jet leaves a signature in the satellite’s data.
Corwin Wright, Royal Society research fellow at the University of Bath in the UK, said, “Changes in the wind structure in a sudden stratospheric warming event have never been observed directly at a global scale before. So far, our understanding of these changes has been developed using point measurements, measurements along localised aircraft flight tracks, through the use of temperature observations, and, primarily, computer models and assimilative analyses.
Profiling the world's winds “However, we can now exploit novel measurements from Aeolus, the first satellite capable of observing winds directly in the upper troposphere and lower stratosphere, to study this process observationally during this current major event.”
Anne Grete Straume, ESA’s Aeolus mission scientist, commented, “We are currently observing a polar vortex event where we see it split into two, with one spinning mass of air over the North Atlantic and one over the North Pacific.
“The split leads to changes in the tropospheric circulation allowing cold air masses from the poles to more easily escape down to lower latitudes. At the moment, parts of North America seem to be experiencing colder weather than Europe, although we have seen events of cold air reaching quite far south in Europe over the past few weeks causing, for example, heavy snowfall in Spain.
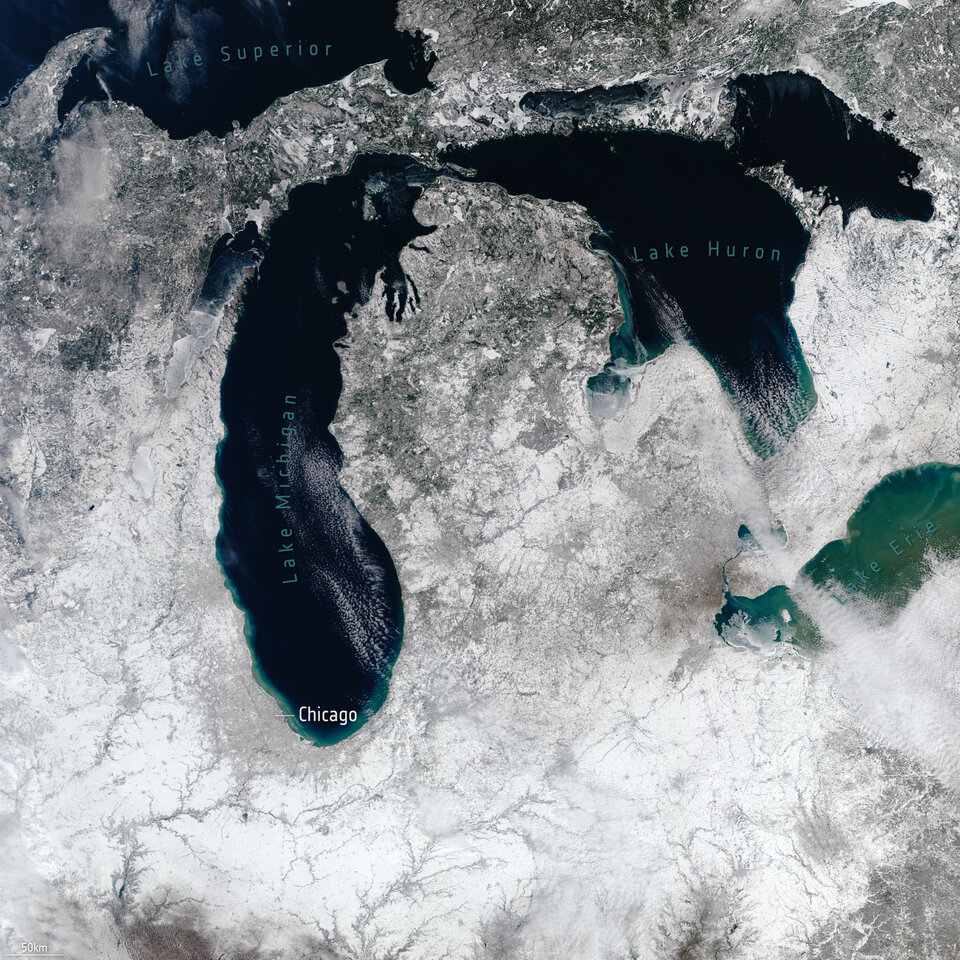
[URL=https://www.esa.int/var/esa/storage/images/esa_multimedia/images/2021/01/snow_near_great_lakes/23130155-1-eng-GB/Snow_near_Great_Lakes_article.jpg]View Image [/URL]
Snow near Great Lakes “What scientists would also like to understand is whether sudden stratospheric warming events might become more frequent owing to climate change. Also for this, Aeolus wind data will be very important to better understand the mechanisms triggering these weather events.
“It is early days yet to draw any scientific conclusions from our Aeolus data, but work is certainly underway to shed new light on why this seasonal phenomenon can sometimes be extreme – watch this space.”
https://www.esa.int/Applications/Observing_the_Earth/Aeolus/Aeolus_shines_a_light_on_polar_vortex

